by
Greg Lipstein
Cold Start Energy Forecasting
Background
Increasing the efficiency of energy consumption has benefits for consumers, providers, and the environment. The ability to forecast a building’s energy consumption plays a critical role in planning efficient policies, optimizing storage for renewable sources, and detecting wasteful anomalies.
But what if a building is just becoming operational, and we don't have much past data for making forecasts?
This "cold start problem" was the focus of the latest Power Laws challenge featuring data from Schneider Electric! More than 1,200 data scientists from all over the world competed to build the most reliable forecasts given only a few days of historical data for each building.
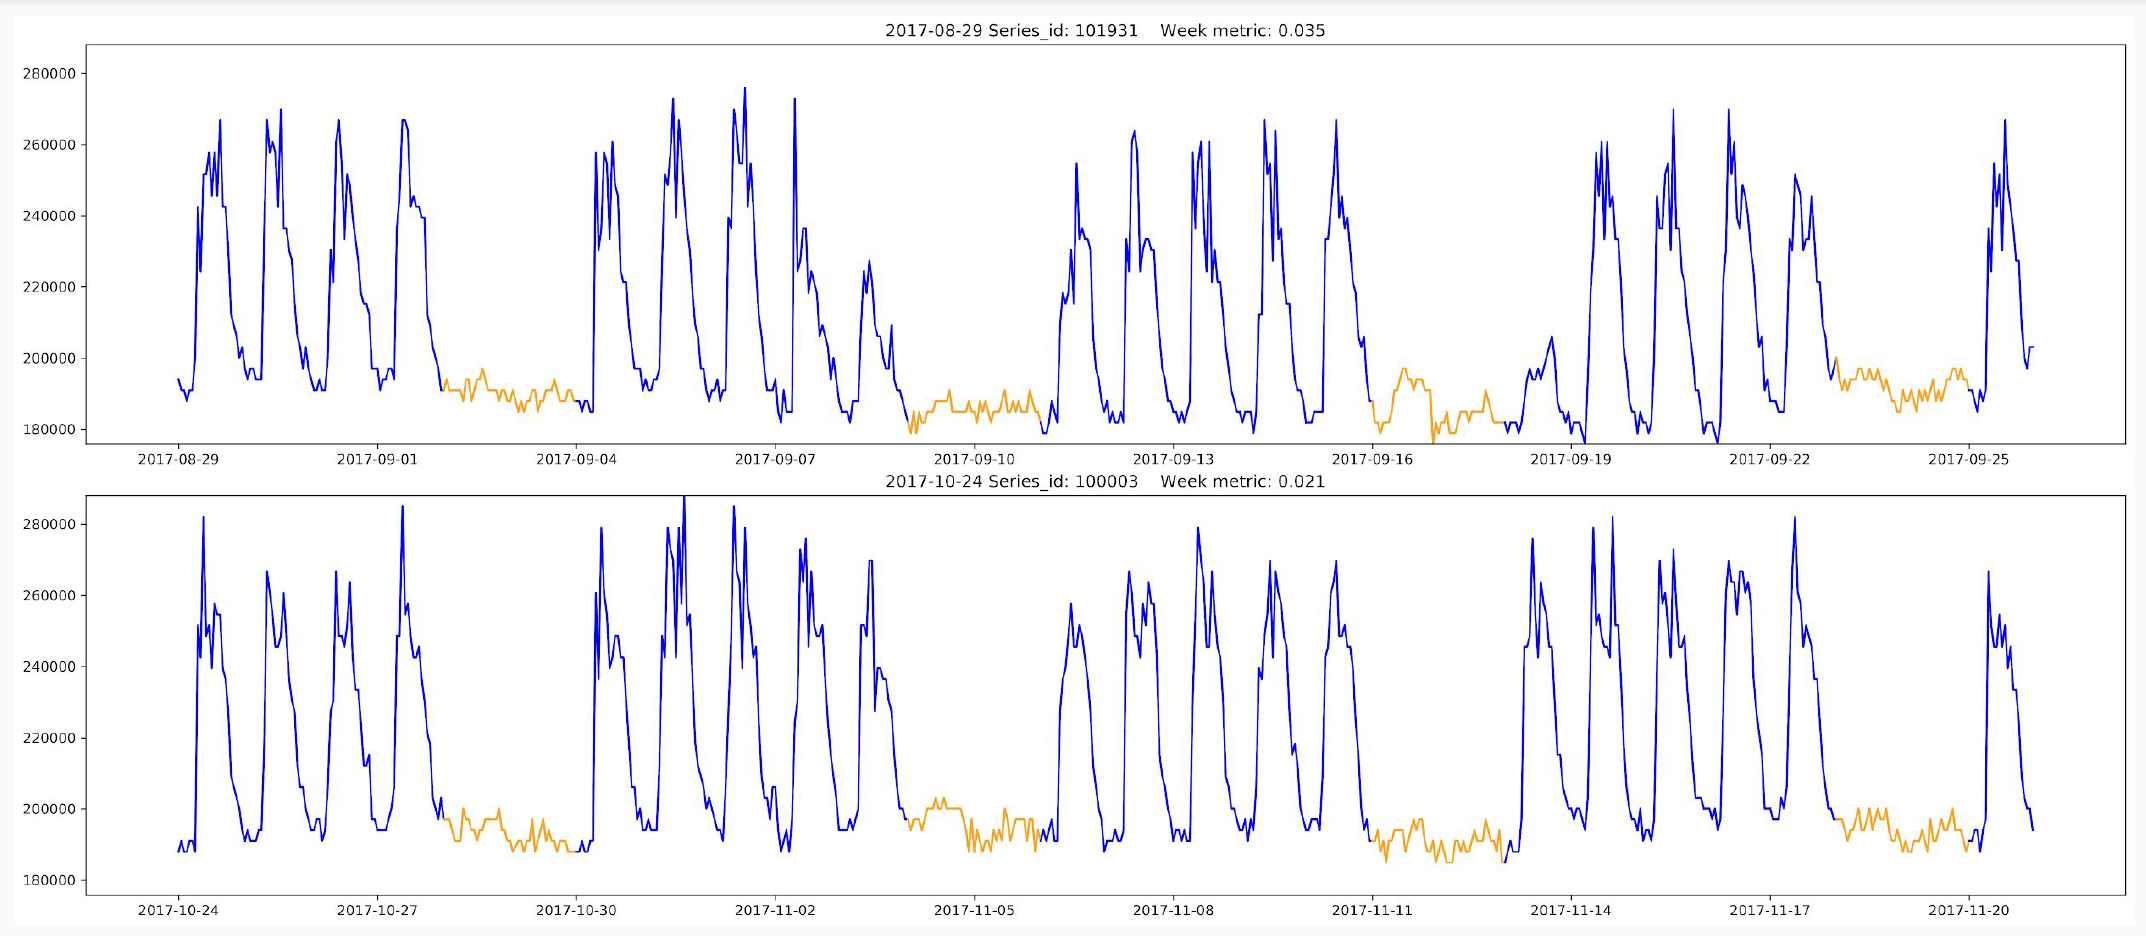
In this competition, things got tricky as we requested hourly, daily, and weekly forecasts of energy consumption. The top-performing algorithm brought the mean absolute error across all prediction series down to 11%. In general, daily and weekly predictions were easier to forecast, and had a median absolute percent error around 7%. This more than halves the benchmark LSTM solution, where this error metric was about 15%. The hourly predictions were more challenging to competitors given the noise in these signals, and these forecasts had a median error closer to 9%. By thinking carefully about how to combine the limited historical information provided with useful meta-data (like holidays), and by tailoring different models to different time windows (hourly, daily, weekly), the winning approaches were able to climb to the top of the leaderboard.
Meet the winners below and hear their hot takes on building the best cold start forecasts!
Meet the winners
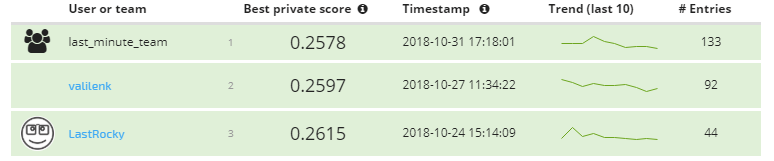
Guillermo Barbadillo and Tomasz Walen (last_minute_team)

|

|
Place: 1st
Prize: €12,000
Hometown: Pamplona, Spain and Warsaw, Poland
Background:
Guillermo: I finished a master in Electronic Engineering 5 years ago. Since June 2014 I have been studying and practicing Artificial Intelligence on my own. My expertise is in applying deep learning to computer vision, but I have also worked with structured data and text. I love doing Data Science challenges and this is the 3rd time I have been lucky to end in a winning position.
Tomasz: I am assistant professor in computer science at University of Warsaw and cofounder and data scientist in Codility (SaaS for automated testing of programmers, used by 1k+ companies around the world). My main research area is the text algorithms and efficient data structures for texts. During last two years I’m enjoying machine learning. I’m also a big fan of data visualization and data story telling.
Summary of approach:
As the team name suggests, these winners came together late in the competition. Finding themselves 3rd and 4th on the leaderboard, ensembling their approaches rose them to the top of the final rankings.
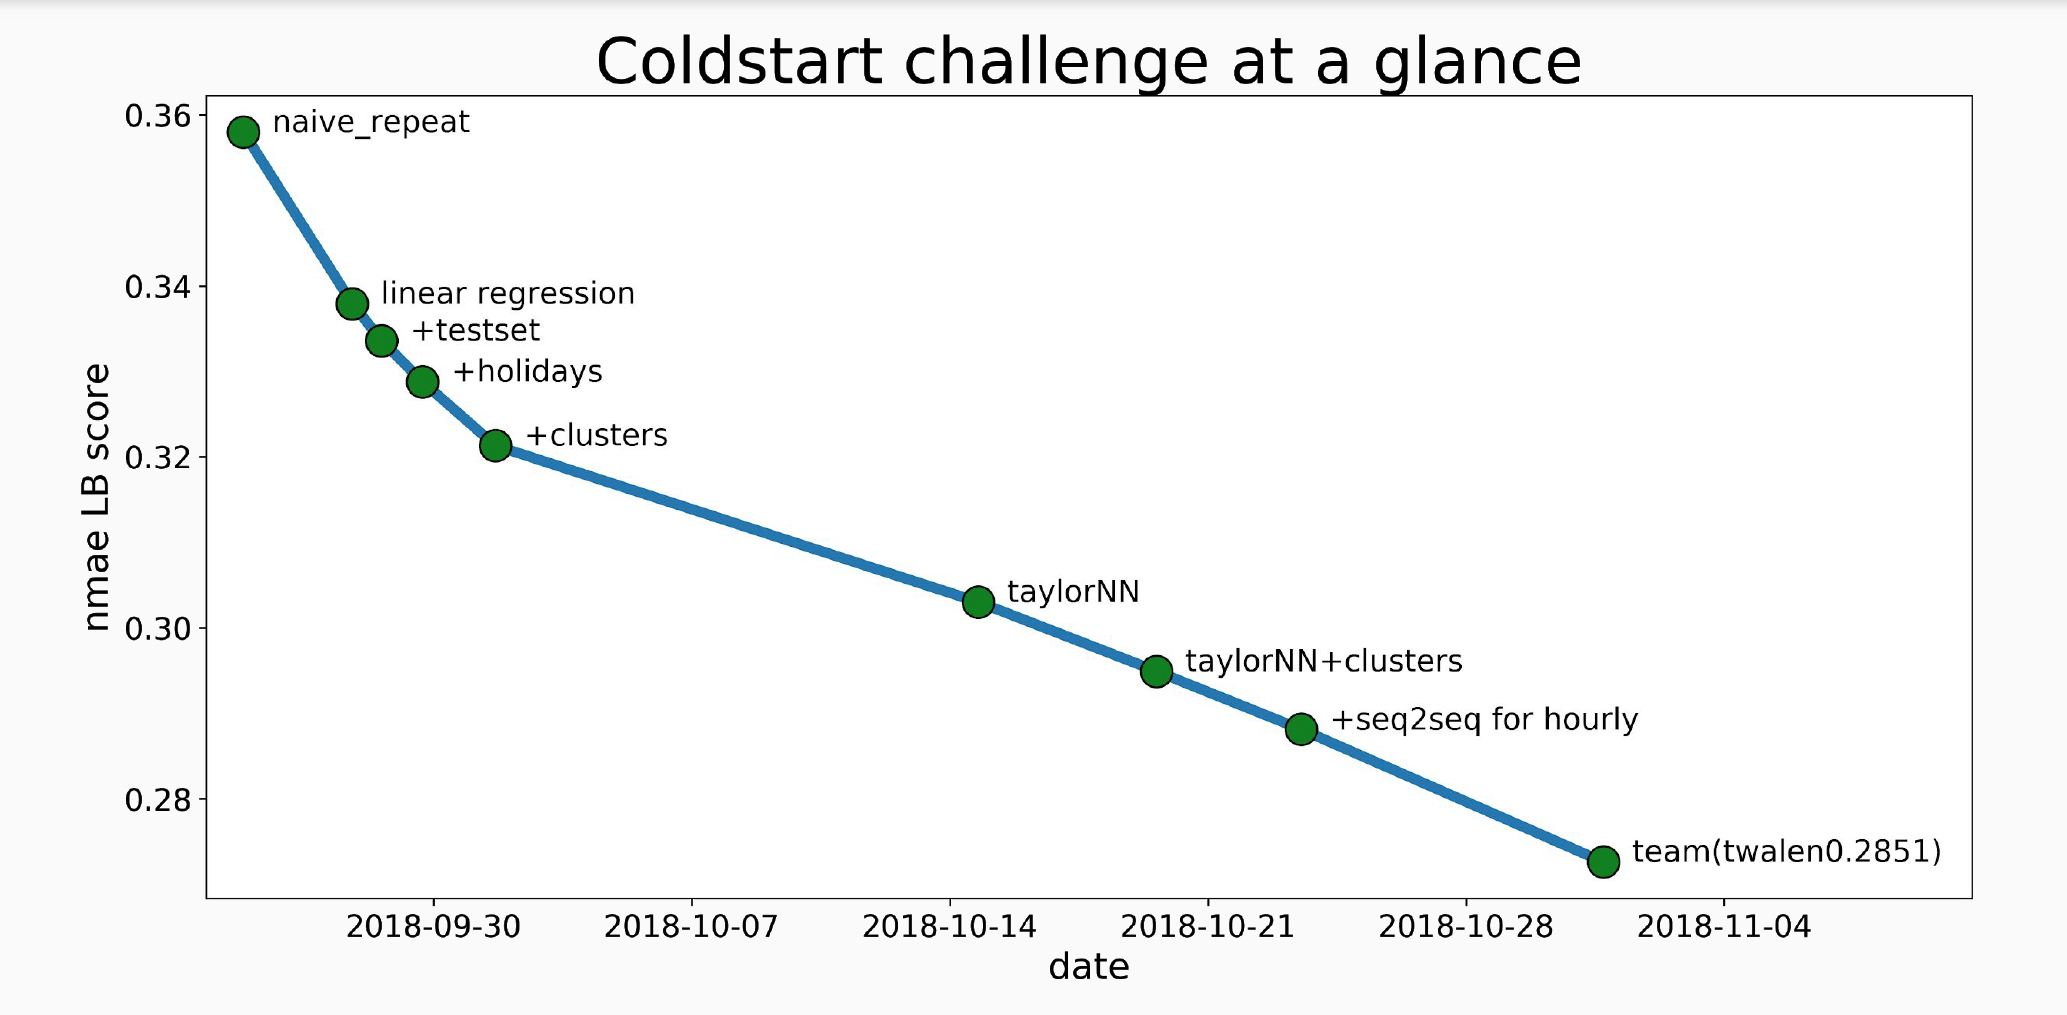
Guillermo: I have prepared a presentation describing my work during the challenge, which can be found in the competition repo below. The approach included trying and learning from:
- Naive repetition
- Linear regression
- Finding holidays in the dataset
- Tailor-made neural network
- Seq2Seq
Tomasz: First I’ve divided the problem into three separate subproblems depending on the prediction window (hourly, daily, weekly). I assumed that each prediction window would require different approach. Since LSTM approach was too complicated and required a lot more computational power, I’ve decided to use simpler neural networks. But in this case it was necessary to handle different length of inputs (different number of cold start days).
The simplest solution was to divide the problem even further by the number of cold start days (to simplify the problem I was not using more than 7 days of cold start data). I’ve ended up with 21 different models (3 prediction windows * 7 cold start days). For each subproblem I’ve tried to select best neural network architecture that would solve it, and the final solution was a mixture of simple FF networks (with 1 or 2 layers) and custom made neural network (used for hourly predictions).
The custom made neural network was created in such a way, that it analyzed the whole input (all lagging consumption and additional features) and then it computed how to multiply each lagging day to best match target day. At the end all of such partial predictions were averaged.
Since our team was created in the very last days, we did not have chance for more in-depth cooperation, our final solution was a simple average of our best solutions. It gave suprisingly good result probably due to the fact that our approaches were complementary.
Check out last_minute_team’s full write-up and solution in the competition repo.
Mikhail Vasilenko

Place: 2nd
Prize: €7,000
Hometown: Moscow, Russia
Username: valilenk
Background: My main focus of work is the use of ML in marketing for small companies. As a rule, they have problems with the availability of big data, so I often encounter the need to find or buy data that will help a company at the stage without a qualitative data processing history.
Summary of approach: My solution contains fastai v1 pipeline with embeddings and additional features based on time, temperature and schedule for each house. For example, I added a rolling mean temperature for different periods of time.
At the start of the competition, scaling to each building played a critical role, however, I also abandoned the idea of teaching separate models for them, as some winners did in the last competition in predicting electricity consumption. A significant point was the rejection of the use of features based on the history of the house, as well as target encodings.
Check out valilenk's full write-up and solution in the competition repo.
Hao Li

Place: 3rd
Prize: €4,000
Hometown: Xuchang, China
Username: LastRocky
Background:
I worked as a data scientist in a IoT startup located in Frankfurt. My daily work is to develop machine learning models for the collected data from different sensors and make analysis. I have a master degree in computer science and communication engineering. I learned machine learning all from online open courses and books.
Summary of approach:
I think there are three key points, which give me a good result, especially in private leaderboard.
The first one is the way I split the data to training data and validation data. Because the provided data is time series dataset and the performance is based on 625 buildings, of which only small amount data is provided, so I use all 758 buildings’ data, which cover 4 weeks time, as training dataset. For the other 625 buildings dataset, based on time, I select a very small part of most recent dataset as validation data to find the best iteration number of the training models and then use all data for retraining.
The second thing is I build two kinds of models, one I called ‘hourly’ model and another ‘daily’ model. For hourly predictions of next 24 hours, I used hourly model and for daily and weekly predictions of next 7 days and 2 weeks, I used daily models to forecast.
The last thing is the way I normalize the consumption values, especially for daily model. Because for some cold start buildings, only 1 day of data is provided, for daily model, we have only 1 value available. Normal normalization methods will fail in this case. So I normalize the daily consumption based on minimal, maximal and mean hour consumption values, which need to be multiplied by 24.
As to prediction models, I build one LSTM based neural network and one lightgbm model. I tried removing anomaly consumptions but with no success. Not much feature engineering work is involved, but only historical consumption values of each building.
Check out LastRocky’s full write-up and solution in the competition repo.
Thanks to all the participants and to our winners! Special thanks to Schneider Electric for another fascinating challenge!