
Data science has enormous potential to improve lives, from detecting cancer to responding to flood disaster events. However, these benefits are not felt equally. Implementing advanced machine learning methods requires training, resources, and time, making data science work subject to existing widespread inequalities based on race, gender, geography, and more. Democratizing the benefits of data science requires changing both how we conduct research and who is involved.
This post provides key actionable steps to make your data science projects more inclusive and equitable. Suggestions are drawn from DrivenData's experience on a variety of social impact projects, and inspired by the broader field of open science:
Open science is defined as the principle and practice of making research products and processes available to all, while respecting diverse cultures, maintaining security and privacy, and fostering collaborations, reproducibility and equity.
— Open science definition from the National Science and Technology Council
Following open science principles can lower the barrier for beginners, increase the diversity of voices in the field, and make data science projects more impactful.
This post will cover:
- Practical recommendations
- Consider in context
- Identify and mitigate bias
- Collaborate
- Be transparent
- Write reproducible code
- Use free tools and datasets
- Apply permissive licenses
- Additional resources
Practical recommendations
DrivenData recently hosted a competition to support NASA's initiative to Transform to Open Science (TOPS). The Pale Blue Dot challenge asked participants to create visualizations using public Earth observation data that advanced the Sustainable Development Goals of zero hunger, clean water, and climate action.
The tips below build on open science recommendations provided to competition participants, and highlight some great examples we saw of open science in action.
Designing your project
 Consider in context
Learn about the real-world context in which your work operates. This includes historical, social, political, and economic factors. Understanding the context can help you better estimate and shape the impact your work will have, both negative and positive.
Conduct background research through reading or interviews with community members and subject area experts. Consider which voices are affected by your work, but excluded from the process of development. If your work applies to a specific community, see if you can bring in community members with lived experience as project partners.
Example

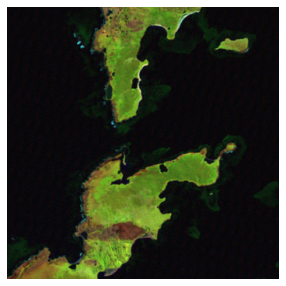
Pale Blue Dot honorable mention winner Mohammad Shabbir Hossain (user shabbir631) was motivated by personal experience of low supply and high prices for food in Bangladesh. Having noticed newly formed coastal land close to his home, he used satellite imagery to visualize how that land could be used for additional food production. Because it was informed by lived experience, his work directly addressed a community need and reflected real-world conditions not easily evident to an outsider.
 Identify and mitigate biases
Equity is a key part of open science. Consider biases that could affect data collection, model performance, and interpretation of your work. Devise strategies for mitigating these risks. For example, re-sample your data to better represent vulnerable groups or suggest limitations for model use. Algorithms can even be applied to correct for past inequalities by taking a reparative approach.
DrivenData recently published a worked example demonstrating how to measure, mitigate and communicate algorithmic bias in partnership with Wellcome. For a more comprehensive guide check out Deon, DrivenData's ethics checklist for data science projects.
 Collaborate
Open science seeks to include more diverse voices in scientific dialogue. Make an effort to gather input from different disciplines, backgrounds, and sectors.
Example
Team Viva Aqua brought together expertise across disciplines (aerospace engineering, GIS, and anthropology) and borders (representing Argentina, Senegal, and the United States). Diverse perspectives helped them design a more effective approach to modeling groundwater in The Gambia, and ultimately win Best Overall Prize in the Pale Blue Dot challenge.
Conducting your analysis
 Be transparent
Document and share the steps that you took to create your final product. The goal is to enable others to reproduce your work, which allows the scientific community to fact check and build on one another's progress. Include details like where your data came from, how you processed your data, and how you created specific visualizations or models.
A great way to increase transparency is to make your codebase available in a public Github repository. Include a README that explains what your project does in plain, non-technical language.
Example
Team Spatial Clan wrote an excellent README to accompany their winning solution in the Pale Blue Dot challenge, which studies the impact of natural disasters on food insecurity in Kenya. The README clearly lays out each step of their process, including details like how they removed outliers. It also describes prerequisite setup steps for their QGIS environment in beginner-friendly language.
 Write reproducible code
Write your code in a way that is well-documented and easy for others to follow. Check out Cookiecutter Data Science, DrivenData's standardized Python project structure, for an easy starting point and more coding best practices.
Sharing your work
 Use free tools and datasets
Using open-source tools and public datasets removes cost-related barriers for others who would like to reproduce or draw from your work, and avoids perpetuating systematic financial and funding barriers.
Example
Participants in the Pale Blue Dot challenge used more than 50 different publicly available datasets, often creatively combining types of data to better understand specific issues. Honorable mention winner Data Science Nigeria mapped areas at high risk of hunger by drawing from both satellite imagery (MODIS) and reports of violent incidents (ACLED).
 Apply permissive licenses
Make any outputs available under permissive licensing. A few commonly used open-source licenses:
- The MIT License is short, simple, and allows others to do almost anything they want with your work.
- The Apache License 2.0 is extremely similar to the MIT license, but has some more explicit terms about things like trademark rights.
- The GNU General Public License v3.0 lets others do almost anything with your work, but requires that anything using your work is also distributed with a public license and makes source code openly available. For comparison, the MIT and Apache licenses allow others to use your work on another project, and then make that project available under any license (including a more restrictive one).
For more options, check out Github's guide to choosing an open source license and the Open Source Initiative's list of open source licenses.
Additional resources
The tips above are just the tip of the iceberg. Dive into the wider world of open science practices with the resources below.
NASA's Open Science 101 (OS101)
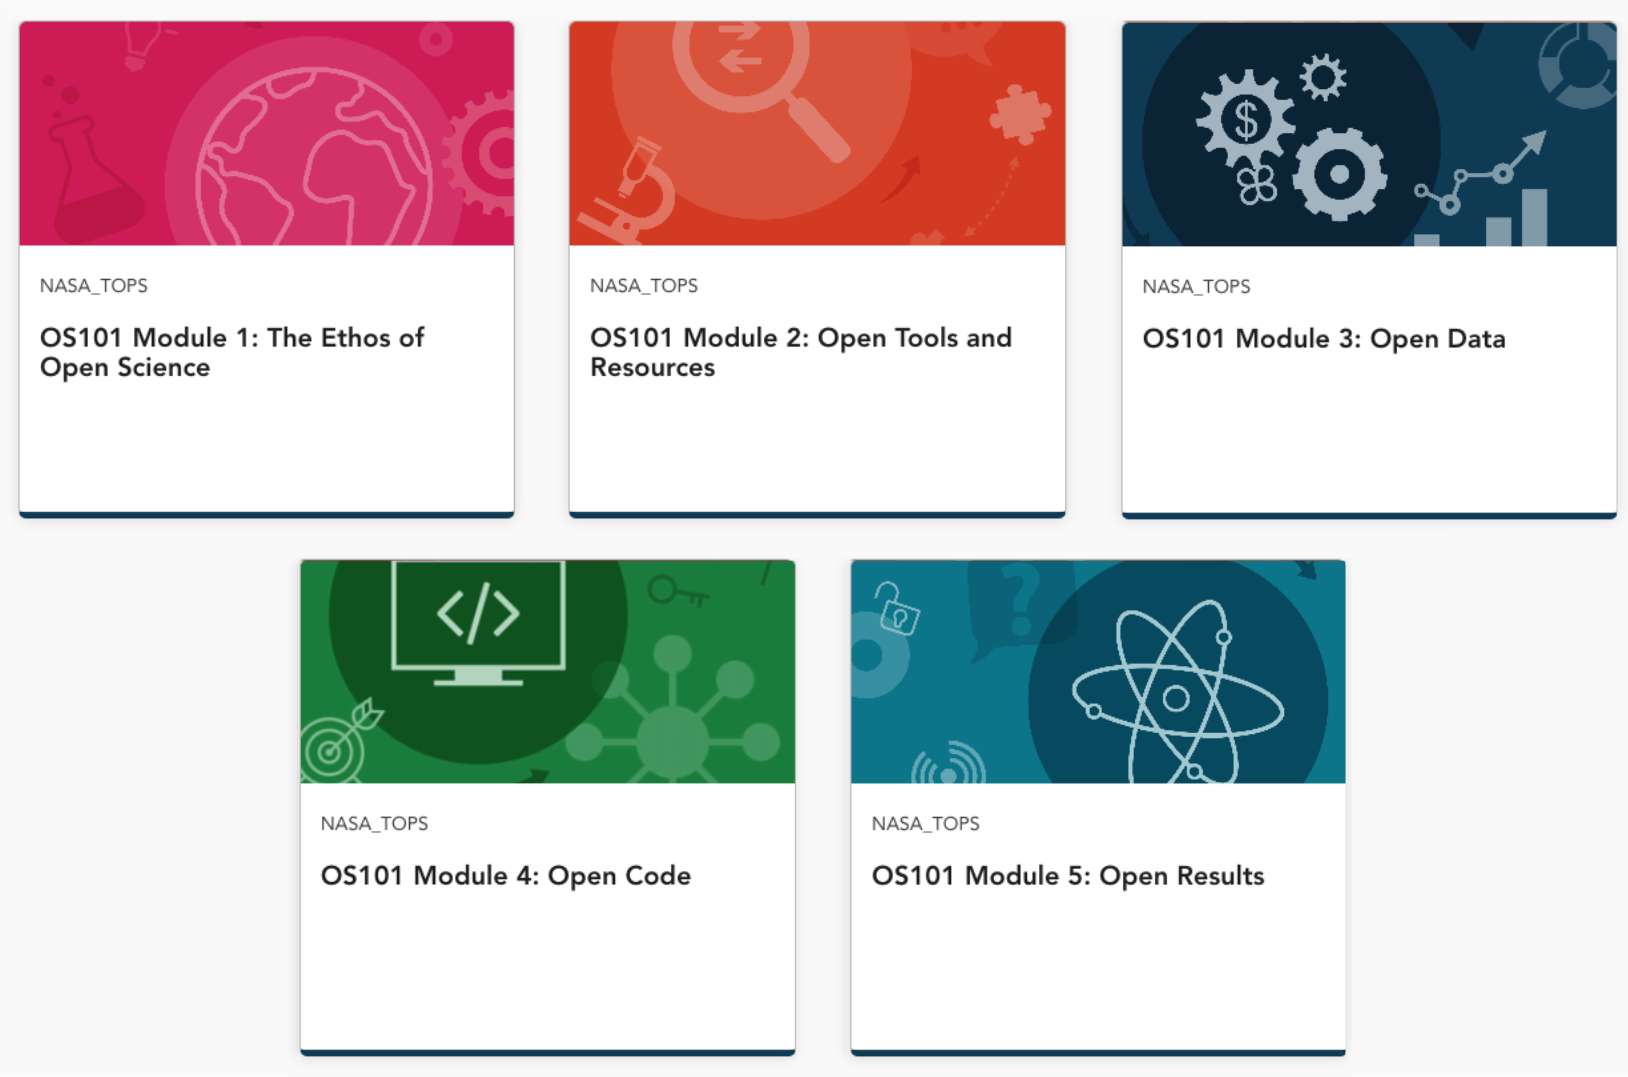
A free, comprehensive, online or in-person training program to introduce scientists, researchers, and citizen scientists to the principles and practices of open science. OS101 covers key concepts, tools, and resources for how to create and share data, code, and results. To register for OS101, participants first need to create an ORCID iD.
Read more about NASA's open science work here.
Deon
An ethics checklist for data science projects created by DrivenData. Deon provides a set of questions to guide ethical discussion at each stage of the data science process, from data collection to deployment.
Cookiecutter Data Science
A reasonably standardized project structure for doing and sharing data science work in Python, created by DrivenData. Cookiecutter provides recommendations for how to organize your codebase to make it easy for others to understand, reproduce, and build on your work.
The Turing Way
An open-source handbook for reproducible, ethical, and collaborative data science. For example, there is a handy guide to getting started with Github and advice for code styling and linting.


