Predicting Poverty with the World Bank
Meet the winners of the Pover-T Tests challenge!
The World Bank aims to end extreme poverty by 2030. To achieve this goal, they need efficient pipelines for measuring, tracking, and predicting poverty.
Measuring poverty is hard, time consuming, and expensive. Poverty estimates are typically obtained from complex household consumption surveys, which collect data on hundreds of variables – everything from food consumption to expenditure on transportation, education, health and others, from assets ownership to housing conditions, and a lot more. By building accurate prediction models, poverty estimates could possibly be obtained more cheaply and effectively from surveys with fewer, more targeted questions. To find out which machine learning methods are best-suited to getting the most out of existing consumption survey data, The World Bank Knowledge for Change Program sought the awesome expertise of the DrivenData community.
In this competition, data scientists from around the world built algorithms to predict household-level poverty status using individual and household-level consumption survey data from three developing countries, each with a different distribution of wealth. The best algorithms pulled out all the stops, creating ensembles of neural networks, XGBoost, LightGBM, and even CatBoost (to leverage the mostly-categorical nature of the survey data) models. Thanks to our competitors, The World Bank can now build on these open source machine learning tools to help predict poverty, optimize survey data collection and analysis, and support work to end extreme poverty.
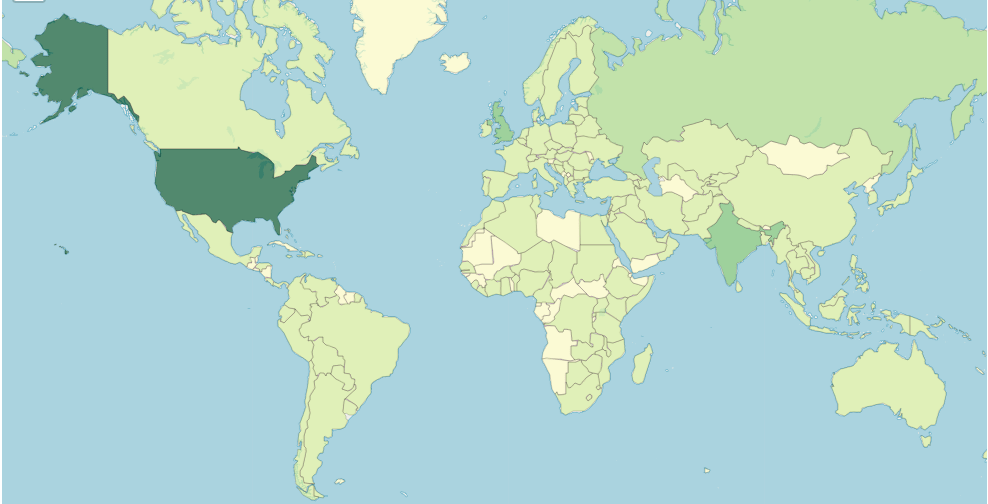
We were inspired by the thousands of global participants throughout this competition, receiving over 13,000 unique visits to the competition page from over 130 countries. Nearly 2,500 visitors signed up and contributed about 6,000 submissions!
Meet the winners below and hear how they applied machine learning to the important challenge of poverty prediction!
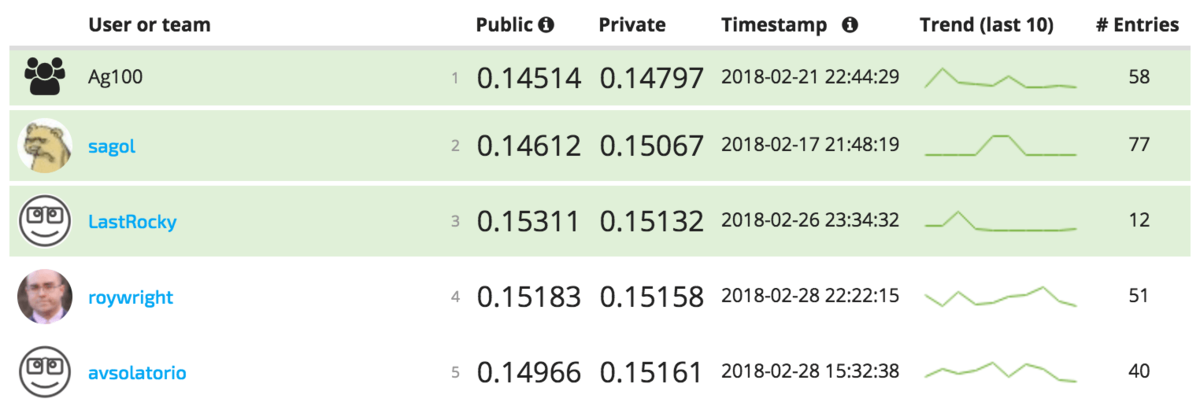
Meet the winners
Team Ag100 (Ricardo Gama, Hugo Fernandes)

|

|
Place: 1st
Prize: $6,000
Hometown: Viseu, Portugal; Porto, Portugal
Username: Ag100: RGama, hugoguh
Background: We met in Portugal during our undergrad and Master's studies in Applied Math.
Ricardo (RGama) - I am a Math teacher at the School of Technology and Management of Lamego, in Portugal. Alongside my professional activities I really enjoy developing scientific / technological outreach projects, like crystal radio construction workshops and VLF signal observations. In past years I have also been involved in developing recommendation algorithms for e-commerce and tourism.
Hugo (hugoguh) - I am a Data Scientist at Rockets of Awesome in New York City. Before I was doing research in Computational Neuroscience at the Kording Lab in Chicago.
Summary of approach:
The solution is an ensemble of models built using gradient boosting (GB with LightGBM) and neural networks (NN with Keras):
A: 5 NN + 4 GB
B: 3 NN + 4 GB
C: 1 NN + 2 GB
In order to reduce the variance of the neural networks we bagged (bootstrap aggregating) some models, sampling 8 times, with replacement, 95% of the training set and averaging the predictions across models.
We tried to take into account the only interpretable feature – household size – when normalizing the features created from the data of the individual household members.
The most challenging part was feature selection: removing unnecessary features while adding new features from the data of the individual household members. We did this using a couple of techniques. A successful one was to simultaneously fit a model to the core group of features and to the group of features we wanted to add/test. We then evaluated the effect that a random permutation on each individual feature had on the predictions of that model. After going through every feature, we removed the ones for which we registered a score improvement.
We used 20-fold cv in Countries A and B in the hope that better out-of-fold predictions would translate into better fits of the optimal weight of each model in the ensemble.
Check out Ag100’s full write-up and solution in the competition repo.
Taras Baranyuk

Place: 2nd
Prize: $4,000
Hometown: St. Petersburg, Russia
Username: sagol
Background: I have been working in IT for many years. Started as a developer in C ++, then Java and Scala. And now I am the head of an expert systems department. I participate in development as an architect and an expert. Data analysis is my hobby, like participating in various competitions.
Summary of approach: Since there are many categorical features in the data and a small size of samples, I decided to use tree-based algorithms (CatBoost, XGBoost and LightGBM). In the final submission, I used an ensemble of the results of each algorithm. The smallest correlation was between CatBoost vs XGBoost and CatBoost vs LightGBM. So, I chose the weights 0.4 for XGBoost and CatBoost, and 0.2 for LightGBM.
Since the data for countries are not balanced, this fact had to be taken into account in the calculations. Cross-validation showed that for countries A and B it is better to use weights in the algorithms, and for country B to make up-sampling.
Since there were already so many features, generating new ones had to be done very carefully, keeping only those that gave a significant increase in cross-validation (the number of unique categories for households, the number of residents, the number of positive and negative values). In addition, cross-validation showed that the data of their individual set for country A did not reduce the error.
After the generation of the feature, I filtered using the feature_importance parameter for each of the algorithms separately, and this significantly reduced the number of features without loss of quality.
Check out sagol's full write-up and solution in the competition repo.
Hao Li

Place: 3rd
Prize: $2,500
Hometown: Xuchang, China
Username: LastRocky
Background: I work as a data scientist in a IoT startup located in Frankfurt. My daily work is to develop machine learning models for the collected data from different sensors and do analysis. I have a master degree in computer science and communication engineering. I learned machine learning exclusively from online open courses and books.
Summary of approach: My method is basically a combination of gradient boosted decision trees and neural networks. For the gradient boosted decision tree models I used the Lightgbm and Xgboost open source python libraries. For the neural networks, I used Keras to build the models. I built one model for each of country A, country B and country C. The final submission is a weighted average of 10-folds cross validation combination of Xgboost model, Lightgbm model and Neural network model for Country A and B. For country C, 10-folds cross validation combination of Xgboost and Lightgbm is used. After the competition I found that 20-fold cross validation improves local validation score a little bit, so this code uses 20-fold cross validation.
Check out LastRocky’s full write-up and solution in the competition repo.
Aivin Solatorio

Place: Bonus - Top Performer from a Low or Lower-Middle Income Country
Prize: $2,500
Hometown: Manila, Philippines
Username: avsolatorio
Background: I'm a Data Scientist currently specializing in AI–primarily in the field of NLP and Information Retrieval. I currently work as a Senior Manager for R&D and leading an R&D team working on applying AI in job matching and recruitment at Kalibrr. I have a Masters degree in Physics and have worked on time-series and complex systems before. I enjoy binging on blogs and YouTube videos about AI and its applications to NLP problems.
Summary of approach: This competition is very challenging due to the anonymous nature of the data. Only very limited feature engineering can be done. Also, without any comprehensible insights about the features, I just decided to use an L1 regularized Logistic Regression model (with its sparse solutions in mind) to set a benchmark. It ended up working pretty well with the country A dataset.
I also threw in the usual models such as Random Forest, XGBoost, LightGBM, and Neural Networks. The tree based models worked pretty well in country B and C datasets—most likely due to the heavily imbalanced nature of the two datasets.
At first, my plan was to perform Bayesian optimization on the parameters to come up with a single best parameter set for each. Later, I realized that I can just combine the best performing variation of the Bayesian optimized models. I ended up building 100 variations by taking the top 20 variations of each model as the meta-models to be used in the final predictions.
The common method in combining these many models is stacking. However, stacking surprisingly didn't work well. It took me a while to realize that I can fairly easily combine an arbitrary number of model results by blending them. Common appoach in blending is by manually assigning weights based on intuition. While this method works for fairly small number of models, this is not scalable to quite a number of models—in this case 100. I was able to solve this problem via a constrained optimization of the model weights.
In the weight optimization process, I used the out-of-fold predictions from each meta-models and constrained the weights such that they sum up to one. The coefficients of the linear combination of the out-of-fold predictions are then optimized based on the loss metric against the actual values. This process was done using stratified cross validation (10-folds) and the coefficients for each fold were then averaged to blend the test meta-predictions.
I think the model could have scored higher if I used more meta-models instead of just selecting the best 20 for each base model. :D
Check out avsolatorio’s full write-up and solution in the competition repo.
Thanks to all the participants and to our winners! Special thanks to the World Bank and their Knowledge for Change Program for putting together the data, funding the challenge, and helping to spread the word about opportunities to use data science for social impact.