Sustainable Industry: Rinse Over Run

Background
Increasing the efficiency of industrial cleaning processes has benefits for consumers, service providers, and the environment. The goal of the Sustainable Industry: Rinse Over Run competition was to harness sensor measurements taken throughout cleaning pipelines, using historical data provided by Schneider Electric, in order to predict cleanliness levels in the final rinse phase. Better predictions can help minimize the use of water, energy and time, all while ensuring high cleaning standards!
The focus of these efforts was on efficient cleaning in the Food & Beverage industry, where strict industry cleaning standards apply to the presence of particles, bacteria, allergens, and other potentially dangerous materials. Resulting cleaning processes require substantial resources in the form of time and supplies (e.g. water, caustic soda, acid, etc.).
This is one area where machine learning can make a difference. Turbidity is a standard industry measure of cleanliness and serves as an important indicator of the efficiency of a cleaning process. The goal of this competition was to create the best possible predictions of turbidity in the last rinsing phase. Depending on the expected level of turbidity, the cleaning station operator can either extend the final rinse (to eliminate remaining turbidity) or shorten it (saving time and water consumption).
There were also a few novel elements of the challenge. In Stage 1: Prediction Competition, the top 15 finishers all earned a part of the prize pool! In Stage 2: Modeling Report Competition, those Finalists were invited to submit brief reports analyzing quantitative patterns in the data and help illuminate which signals at which moments are mainly responsible for the presence of turbidity during the final rinse.
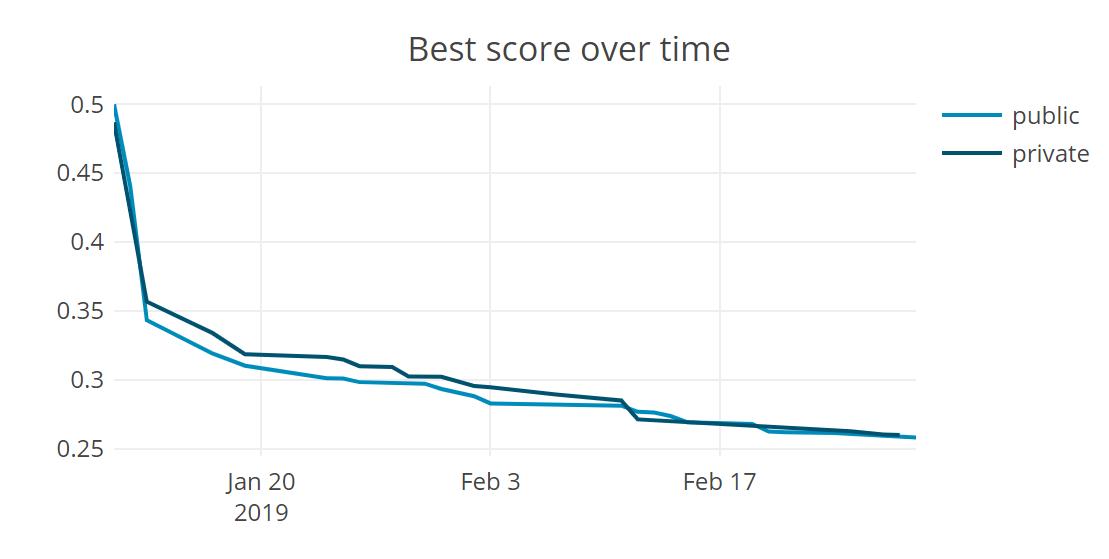
More than 1,200 data scientists from all over the world entered the competition, generating around 2,000 submissions over 50 days. Final scores were based on mean absolute percent error, indicating how closely predicted turbidity levels matched actual measurements. The winning models achieved scores of just 27% - a dramatic reduction compared to more than 5x the error reported by the pre-challenge benchmark (146%)!
Meet the winners below and hear their fresh takes on building the best models! You can also find links to all 15 prize-winning algorithms, released under an open source license to support open capabilities for managing natural resources in an era of environmental change.
Meet the winners
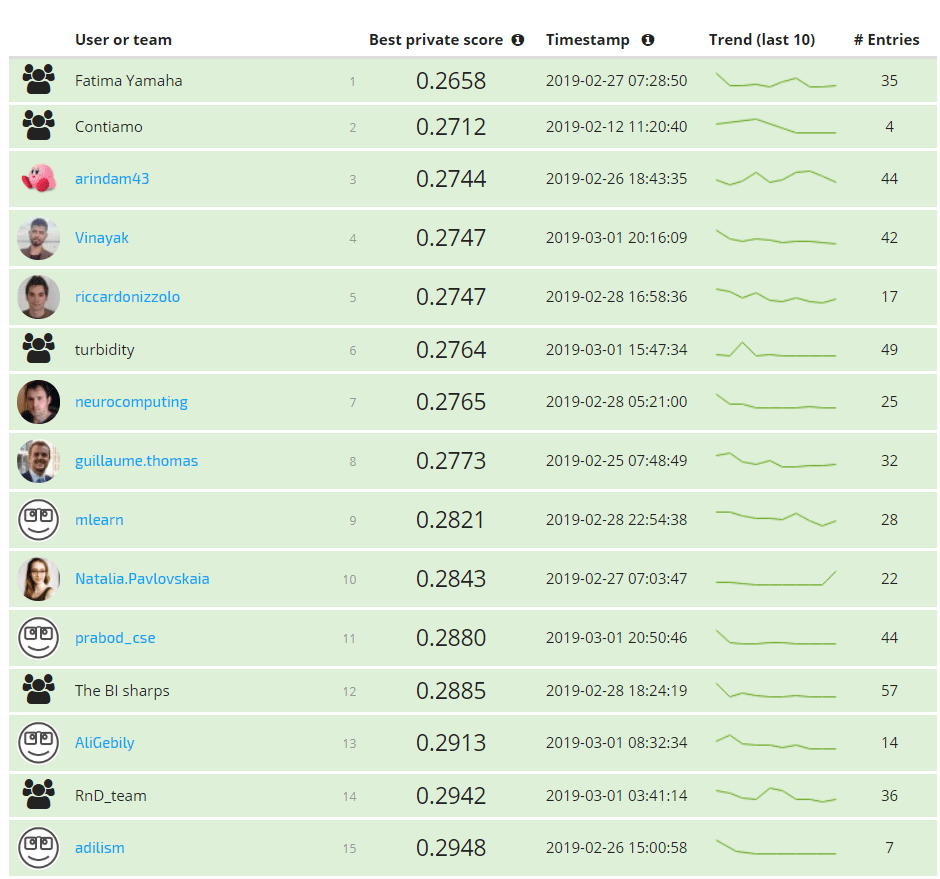
See the full leaderboard
Contiamo (Nicolas Gautier, Ian Solliec, Brandon Williams)

|

|

|
Place: 2nd (Prediction) + 1st (Modeling Report)
Prize: €8,500
Hometown: Berlin, Germany
Username: ngautier, ian-contiamo, bwilliams
Background:
Nicolas Gautier has background in experimental physics. After working as a physical simulation software salesman, he joined Contiamo where he is responsible for customer on-boarding, delivering proof of concepts, and advanced process analytics research
Ian Solliec has an applied mathematics background. He worked in finance for almost a decade, developing pricing and risk models, before joining Contiamo.
Brandon Williams has a mathematics background. He has worked at tech startups in a variety of industries such as healthcare and insurance.
Summary of approach:
We truncated phases in the training data in order to match the phase distribution of the test set, and we split the training data into a training set and a validation set. We transformed time series data into features, so that the resulting structured data could be fed to standard machine-learning algorithms. We decided to model the log of the target variable, as it was better distributed. We then tried a variety of algorithms, settling on Gradient Boosted Trees based on its good initial performance. We tried to fine-tune the model's hyper-parameters, but there was little improvement.
Check out Contiamo’s full write-up and solution in the competition repo.
Arindam Bhattacharya

Place: 3rd (Prediction) + 2nd (Modeling Report)
Prize: €3,500
Hometown: Chicago, USA
Username: arindam43
Background:
I am currently a Data Scientist at Opex Analytics, an advanced analytics consulting firm based out of Chicago. Prior to joining Opex, I completed my Master of Science in Analytics from Northwestern University in 2017, and before that I worked in credit risk analysis for an American department store. I am passionate about combining the technical aspects of data science, such as mathematics and programming, with business knowledge and practical considerations to create useful and impactful data-driven solutions. I also enjoy participating in data science competitions, which provide excellent opportunities to learn new machine learning techniques and apply them to real-world problems.
Summary of approach:
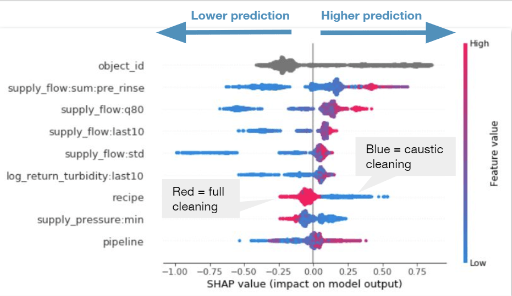
I built four separate models to reflect the ends of the four different stages at which we were asked to make predictions: pre rinse, caustic, intermediate rinse, and acid. Each feature was generated at a phase-level or lower and “unmelted” to produce the final features at a process-level. Mid-cleaning predictions were simulated by excluding the appropriate predictors from each model. I chose pure LightGBM so that the relationships between the predictors and the response would be easy to understand. I used Shapley Additive Explanations (SHAP). The summary plot provided an easily interpretable view of variable importance, and dependence plots clearly illustrated the effect of individual predictors (or pairs of predictors if interactions were highlighted) on each prediction.
Check out arindam43's full write-up and solution in the competition repo.
Riccardo Nizzolo

Place: 5th (Prediction) + 3rd (Modeling Report)
Prize: €2,000
Hometown: Milan, Italy
Username: riccardonizzolo
Background:
Riccardo is a Data Scientist at BCG gamma. He focuses on building machine learning models at scale for data driven decision making. Riccardo has experience with Agile development and he is a certified scrum master. Before BCG Riccardo worked as data scientist for an energy company with focus on energy price predictions. He worked also for an IT consulting Firm building data driven applications for finance, retail and aerospace industries.
Summary of approach:
I trained a two-layer stacked model of LightGBM. The model was trained on the maximum available granularity (i.e. time series level) and then aggregated with a weighted median to obtain predictions with process granularity.
Check out riccardonizzolo’s full write-up and solution in the competition repo.
Fatima Yamaha (Gilles Vandewiele, Thomas Mortier)

|

|
Place: 1st (Prediction)
Prize: €500
Hometown: Ghent, Belgium
Background:
Gilles Vandewiele is, just like all other team members, a computer science engineer. He’s 25 years old and lives in Ghent (Belgium), but is originally from the much more beautiful Bruges, a few kilometers West. Gilles is currently working as a PhD Student for the Internet and Data Science Lab (IDLab) at the University of Ghent, where he is conducting research in the domain of (white-box) machine learning and Semantic Web technologies. Gilles is passionate about sport-related data science, video games (and writing AIs for them), Python, and loves playing football.
With master’s degrees in Computer Science Engineering and Statistical Data Analysis, Thomas Mortier is currently working as a teaching assistant and PhD student for the research unit KERMIT (Knowledge-based Systems) at the Faculty of Bioscience Engineering, University of Ghent. His current research interests include Bayes-optimal multilabel and multi-class classification algorithms. If you can’t find Thomas behind his desk, you’ll probably find him cycling, playing football, cooking in the kitchen or spending time with his girlfriend or friends.
Summary of approach:
We extracted aggregates and descriptive statistics from the time series of each process. These features were fed to roughly 25 sci-kit learn regressors to create out-of-sample predictions for training and test set. These out-of-sample predictions were then fed, along with the original features to three gradient boosting algorithms: CatBoost, eXtreme Gradient Boosting (XGB) and Light Gradient Boosting Machines (LGBM). Finally, the average from the predictions generated by the gradient boosters was calculated and used as submission. The final percentage was gained by taking the average of previous submissions.
Check out Fatima Yamaha’s full write-up and solution in the competition repo.
Vinayaka Raj T

Place: 4th
Prize: €500
Hometown: Chennai, India
Username: Vinayak
Background:
I am a multidisciplinary data scientist with a passion for building predictive models to help automate business process workflows in different business functions of IT industry. I have 7 years of experience in this field and mostly worked in data science projects pertaining to contact center, retail, manufacturing and energy industries.
Summary of approach:
I used features based on summary statistics on the provided features/phase, global features (without considering the phase), final rinse features, two-way interaction features, and features created using the response variable. I used a single LightGBM model with the above mentioned features because it is easy and fast to train, requires little preprocessing, and handles null values. This was followed by quantile regression.
Check out Vinayak’s full write-up and solution in the competition repo.
turbidity (Tomasz Walen)

Place: 6th
Prize: €500
Hometown: Warsaw, Poland
Username: twalen
Summary of approach: First I divided the problem into several problems: I trained a separate model for each expected recipe mask (1111, 1001, 1100) and for each number of available phases (1, 2, 3, 4). I used a linear combination of Keras and LightGBM models. I used multiple aggregate features (like length of each phase, sum/mean turbidity in each phase, mean tank levels, mean/max pressure, etc.). I used target mean features that were used for scaling the target values. For computing target mean I've used weighted median and segmentation of data by expected recipe mask and object id. For local validation I used a time-based split. The final submission is a blend of two solutions generated from two different random seeds.
Check out twalen’s full write-up and solution in the competition repo.
Bernd Allmendinger

Place: 7th
Prize: €500
Hometown: Rottenburg, Germany
Username: neurocomputing
Summary of approach: I build a separate simple gradient boost model for each of the each of the 4 cases: process_id with phases = 1, process_id with phases <=2, process_id with phases <=3, process_id with phases <=4. To predict the final_rinse_total_turbidity_liter in the test data, for process_id in the test data the maximum number of phases are determined and the prediction was made with the corresponding phase-model.
Check out neurocomputing's full write-up and solution in the competition repo.
Guillaume Thomas

Place: 8th
Prize: €500
Hometown: Paris, France
Username: guillaume.thomas
Summary of approach: For each process and for each process step, consider a subprocess with data only up to this step for the training. Associate a weight accordingly to the test distribution (0.1 for process ending at pre_rinse, 0.3 otherwise). Generate for each subprocess simple time-domain aggregations. Focus on ensemble methods (especially LightGBM). Reduce weights of high targets which penalized the evaluation metrics.
Check out guillaume.thomas's full write-up and solution in the competition repo.
mlearn

Place: 9th
Prize: €500
Hometown: United Kingdom
Username: mlearn
Summary of approach: I followed feature extraction by fitting a conventional supervised learning model. The idea was to maximise the chance of interpretability by looking for relationships to simple features. I used data augmentation to increase the size of the training set. Each base process led to four training processes with truncation to each phase. Weights were used to match the competition setup. I used weights to both handle the data augmentation and also to convert the MAPE target into a an MAE problem. I fit a large gradient-boosted model with LightGBM.
Check out mlearn's full write-up and solution in the competition repo.
Natalia Pavlovskaia

Place: 10th
Prize: €500
Hometown: Moscow, Russia
Username: Natalia.Pavlovskaia
Summary of approach: I use LSTM for processing the data of the time series. LSTM is known as a good feature extractor for sequential data, and it can be applied to the sequences with different lengths. I take the output of LSTM together with the process' metadata and send them in a small neural network with 4 dense layers. The last layer's output is a single number because we have a regression task here. I optimize directly the competition metric. In order to prevent overfitting I augment the initial data to enlarge the training dataset. Finally, to get my best result I use test time augmentation. This approach allows us to have a single model instead of a separate model for each process. Because we can process time series with different lengths. And we don't create any SARIMA-like model to make a predict for each process separately.
Check out Natalia.Pavlovskaia's full write-up and solution in the competition repo.
Prabod Rathnayaka

Place: 11th
Prize: €500
Hometown: Singapore
Username: prabod_cse
Summary of approach: I employed a gradient boosting tree model (LightGBM) with a 10-fold stacking startegy. The model was trained on aggregated statistics of the last n records of a process (n =10, 50, 200, 500). Also, phase-based statistics and time-based statistics were used.
Check out prabod_cse's full write-up and solution in the competition repo.
The BI Sharps (David Belton, Pat Walsh)

|
|
Place: 12th
Prize: €500
Hometown: Dublin, Ireland
Summary of approach: Our approach starts by taking every phase of every process and aggregating the data on metrics such as Max, Mean, Min etc. We engineer some features to interpret the boolean features and keep track of phase using dummies. We gave each phase a record as this allowed us to deal with processes with different numbers of phases in the same way. This data is sent along 2 separate flows. Flow 1: group the data by object_id, remove outliers based on the target variable, and create an XGboost Regressor for each object_id. This gives us a up to 4 predictions for each process_id (one for each phase in the process) and we take the minimum of these as our prediction from Flow 1 (as this performed best for the MAPE metric). Flow 2: We cluster similar object_ids based on the median, skew, and kurtosis of the target variable. This gives us much larger training sets as small sets were an issue for Flow 1. We then group the data by cluster & remove outliers based on the target variable. Then we create an XGboost Regressor for each cluster this again gives us a up to 4 predictions for each process_id (one for each phase in the process) and we take the minimum of these as our prediction from Flow 2. We then take a blend of the predictions from the two flows as our prediction.
Check out The BI Sharps' full write-up and solution in the competition repo.
Ali El-Gebily

Place: 13th
Prize: €500
Hometown: Faiyum, Egypt
Username: AliGebily
Summary of approach: We predict turbidity of a process using multiple xgboost models, where each model predicts turbidity based on data of a single phase or combinations of phases for that process. This approach is building optimized models based on testing data structure and evaluation metric.
Check out AliGebily's full write-up and solution in the competition repo.
RnD_team (Francisco Mendez, Kunnal Kainth)

|

|
Place: 14th
Prize: €500
Hometown: Ontario, Canada
Username: fco_nick, adamantium86
Summary of approach: The approach used consisted in summarizing the measurements of each process by stage, dividing each process recorded into different groups according to the phases provided in the test set and training one random forest for each group. Each process was divided in 5 different phases and it recorded different measurements of the cleaning status every 2 seconds. We summarize each of the measurement by phase, obtaining 1 or 2 statistics of each measure. Additionally to this,we calculated the average of the target by object excluding outliers. Since each process had recorded different phases we subset the test data according of the observed phases in 6 different groups and we created 6 different training set for each group. For each group we trained and tune independently 6 random forests, most of the variables kept in each forest were similar among each other. For each process in the test we used the random forest that corresponded to the observed phases of the process.
Check out RnD_team's full write-up and solution in the competition repo.
Adilizhan Ismailov

Place: 15th
Prize: €500
Hometown: Barcelona, Spain
Username: adilism
Summary of approach: The solution consists of four GBM models for each of the four phases. The approach was the following: Generate train sets for each of the phases using the original train set. Generate statistical features (such as min, median, max, standard deviation) for each time series and features derived from the metadata. Estimate a LightGBM model with five-fold cross-validation. Bag the predictions using different seeds to create the folds.
Check out adilism's full write-up and solution in the competition repo.
Thanks to all the participants and to our winners! Special thanks to Schneider Electric for another fascinating challenge!