NASA Airport Configuration Benchmark
Coordinating the national airspace is a fascinating problem affecting individual travelers, the economy, and the environment. One important piece of the puzzle is how airport operators make best use of an airport's many runways. The specific set of runways active for departing and arriving flights is the "airport configuration," and knowing when to use which configuration is an important piece of the air traffic management puzzle.
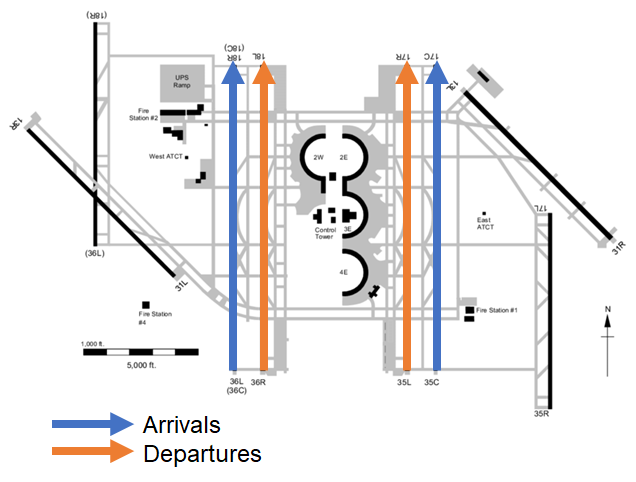
Thanks to NASA, the FAA, airlines, and other agencies, there is a massive stream of real-time data available to aid in effective decision making. Now it's up to you to learn how to best use it! Below is a diagram of an airport configured in a "north flow" with 2 runways active for departures (orange arrows), 2 for arrivals (blue arrows) and 4 inactive runways (thick black lines).
The Run-way Functions: Predict Reconfigurations at US Airports competition sets you up with historical air traffic, airport configuration, and weather data to learn how runways at 10 airports will be configured in the future. Check out the Problem description for more background.
This blog post is intended to familiarize you with the competition data and to get started thinking about how to approach this challenge. It reads the training data and one of the data files, makes predictions with a relatively simple algorithm, and computes the scoring function.
You can use snippets from this notebook in your solution and you can use this algorithm as a starting place (but you don't have to!).
from pathlib import Path
from typing import Sequence, Tuple

import matplotlib as mpl
import matplotlib.pyplot as plt
import numpy as np
import pandas as pd
import seaborn as sns

mpl.rcParams["figure.dpi"] = 100
sns.set_style("whitegrid")
pd.options.display.width = 200
Get the data
To run this notebook, you'll first need to download the following files from the Data download page (available after you've joined the competition):
Training features (
train_features.tar): A tar archive containing air traffic, airport configuration, and weather features for the 10 airports from Nov. 2020 to Nov. 2021. Each feature is saved as a bzip2-compressed CSV.Training labels (
open_train_labels.csv.bz2): Labels for the open arena training period.Submission format (
open_submission_format.csv): A simple submission that predicts a uniform probability across all configurations. Use this an example of a properly formatted submission.
Once you have downloaded the data files, you can unpack the tar file like this:
tar -xf train_features.tarAnd then you can delete the tar file.
Make sure that the following path leads to the data files you downloaded. If the files are in the same directory as the notebook, set the path to ".".
DATA_PATH = Path("../data")
The following cell lists the data directories for each airport.
airport_directories = sorted(path for path in DATA_PATH.glob("k*"))
airport_directories
There are 10 airports spread throughout the continental US. Here's a map showing their locations.

Picking one airport as an example, here are the data files.
airport_directory = airport_directories[0]
data_files = list(airport_directory.glob("*"))
data_files
The one we'll use in this notebook is katl_airport_config.csv.bz2, which contains the actual configurations during the training period.
airport_code = airport_directory.name
filename = f"{airport_code}_airport_config.csv.bz2"
filepath = airport_directory / filename
filepath
We can read the file like this, and display the first few lines.
airport_config_df = pd.read_csv(filepath, parse_dates=["timestamp"])
print(airport_config_df.shape)
airport_config_df.head()
timestampis the time when the configuration was recorded; they are a roughly one-hour intervals.airport_configis a string that represents the runways in use at the given time. For example,D_8R_9L_A_10_8L_9Rmeans that the runways in use for departure were 8R and 9L, and the runways in use for arrivals were 10, 8L, and 9R.
The following function takes the path to the data directory for a given airport, reads the airport configuration file, and returns the airport code and a Pandas DataFrame containing the data.
def read_airport_configs(airport_directory: Path) -> Tuple[str, pd.DataFrame]:
    """Reads the airport configuration features for a given airport data directory."""
    airport_code = airport_directory.name
    filename = f"{airport_code}_airport_config.csv.bz2"
    filepath = airport_directory / filename
    airport_config_df = pd.read_csv(filepath, parse_dates=["timestamp"])
    return airport_code, airport_config_df
I'll use this function to make a dictionary that maps from each airport code to the airport configuration DataFrame.
airport_config_df_map = {}

for airport_directory in sorted(airport_directories):
    airport_code, airport_config_df = read_airport_configs(airport_directory)
    print(airport_code)
    airport_config_df_map[airport_code] = airport_config_df
To check the contents of this data structure, here are the airport codes and the lengths of the airport configuration DataFrames.
for airport_code, df in airport_config_df_map.items():
    print(f"{airport_code}: {len(df):>8,}")
Read the training labels
Let's load the training data.
open_train_labels = pd.read_csv(
    DATA_PATH / "open_train_labels.csv.bz2", parse_dates=["timestamp"]
)
open_train_labels.shape
There are about 22 million rows. Here's what the first few rows look like.
open_train_labels.head()
The columns are:
airport: string airport codetimestamp:pd.Timestampwith the time when we should generate a prediction.lookahead: number of minutes in the future we're trying to predict.config: string representing a possible configurationactive: float 0 or 1 indicating whether a particular configuration was actually active during the future we're trying to predict.
In open_train_labels, only one configuration is active (assigned probability 1) and the others are inactive (assigned probability 0).
Our job is to generate predictions in the same format as the training labels, except that the values in active will be probabilities between 0 to 1.
Get a sample frame
One way to think about open_train_labels is as a sequence of "prediction frames", where each frame represents a prediction for a given airport, at a particular time, for a given point in the future.
Each frame contains one row for each of the most common configurations (for that airport), plus a catch-all bucket called other.
To iterate through the frames in predictions, we can make a groupby object.
sample_frame_groups = open_train_labels.groupby(
    ["airport", "timestamp", "lookahead"], sort=False
)
As an example, I'll select just the first frame.
for name, pred_frame in sample_frame_groups:
    print(name)
    break
pred_frame
This frame represents a prediction for katl at 2020-11-06 23:00:00 for 30 minutes in the future.
Our job is to fill the active column with probabilities.
Given a prediction frame, we can get the airport code, timestamp, and lookahead like this:
first = pred_frame.iloc[0]
airport_code = first["airport"]
timestamp = first["timestamp"]
lookahead = first["lookahead"]

print(f"Airport code: {airport_code}")
print(f"Timestamp: {timestamp}")
print(f"Lookahead: {lookahead}")
Uniform prediction
As a simple example, suppose we have no reason to think one configuration is more likely than another. In that case, we could generate a uniform distribution where each configuration has the same probability.
The following function takes a prediction frame and returns a Pandas Series that represent a predictive distribution.
def make_uniform(pred_frame: pd.DataFrame) -> pd.Series:
    indices = pred_frame["config"].values
    uniform = pd.Series(1, index=indices)
    uniform /= uniform.sum()
    return uniform
Here's a the result using the prediction frame from the previous section as an example.
pred_dist = make_uniform(pred_frame)
pred_dist
Make distribution of configurations
Now let's think about making predictions. In reality, we will have good reasons to think that some configurations are more likely than others; that's the whole point of the competition!
Suppose we know that the configuration has changed, but we don't know what the new configuration is. If that's all the information we have, a reasonable predictive distribution would be the distribution of configurations we've seen in the past.
To demonstrate, I'll select the sequence of configurations from one airport.
airport_code = "katl"
airport_config_df = airport_config_df_map[airport_code]
airport_config_df.head()
The airport configuration dataset is comprised of reports, and the amount of time between reports is not guaranteed to be equal. So the number of times a configuration appears in the dataset is not the same as the amount of time that configuration is active. To get that, we'll first resample the configuration data to regular intervals; let's say every 15 minutes. Note the use of ffill which propagates non-null values forward to fill in missing values (thus making sure we aren't leaking information from the future).
config_timecourse = (
    airport_config_df.set_index("timestamp")
    .airport_config.resample("15min")
    .ffill()
    .dropna()
)
config_timecourse.head()
Now we can count the number of occurrences with value_counts to know how long each configuration was active.
config_dist = config_timecourse.value_counts().sort_values(ascending=False)
print(f"Number of unique configurations at {airport_code.upper()}: {len(config_dist)}")
config_dist
In the course of a year, KATL uses 156 unique configurations! Other airports use more than 200. Still, airports tend to favor a much smaller subset of configurations the majority of the time. At KATL, just 2 configurations account for 74% of the time. For this competition, the prediction target groups uncommon configurations are grouped into an "other" bin.
ax = ((config_dist / config_dist.sum()) * 100).head(20).plot(kind="bar", figsize=(8, 3))
ax.set_title("Configuration distribution for top 20 configurations")
ax.set_ylabel("Percent of time active")
ax.yaxis.set_major_formatter(mpl.ticker.PercentFormatter(decimals=0))
plt.show()

One assumption this approach makes is that the distribution of configurations is stationary, i.e., it does not change over time. Let's use the configuration timecourse to visualize how well assumption holds up. We'll breeze by the pandas transformations for now, but feel free to explore the details on your own.
import colorcet as cc
from cycler import cycler

with mpl.rc_context({"axes.prop_cycle": cycler(color=cc.glasbey_bw)}):
    fig, ax = plt.subplots(figsize=(10, 6))
    ax.set_axisbelow(True)
    sns.set_style("whitegrid")
    x = (
        config_timecourse.reset_index()
        .groupby(
            [
                pd.Grouper(key="timestamp", freq="7D", axis=0),
                "airport_config",
            ]
        )
        .size()
        .unstack()
        .fillna(0)
        .astype(int)
    ) / 4
    x.index = x.index.astype(str)
    x[x.sum().sort_values(ascending=False).index].plot(
        kind="bar", stacked=True, width=1, ax=ax
    )
    handles, labels = ax.get_legend_handles_labels()
    ax.legend(handles[:20], labels[:20], bbox_to_anchor=(1, 1), loc="upper left")
    ax.set_title(f"Configuration distribution by week for {airport_code.upper()}")
    ax.set_xlabel("")
    ax.set_ylabel("Hours per week")
    plt.show()

There is definitely some variation week-to-week, with first and second most common swapping places occasionally. Overall, I'd say there aren't any seismic shifts in the distribution, although (spoiler alert) that isn't the case for all of the airports. You'll have to consider how to handle those cases; for example, you might upweight more recent time periods when computing your distribution.
Notice that the labels in this series do not include the airport code. To make them consistent with the config column in open_train_labels, we have to prepend the airport code, which we can do like this:
prefix = pd.Series(f"{airport_code}:", index=config_dist.index)
config_dist.index = prefix.str.cat(config_dist.index)
config_dist
The following function encapsulates these steps. It takes an airport code, a DataFrame containing timestamps and configurations, and a boolean that indicates whether the results should be normalized so they add up to 1 (like valid probabilities should). It returns a Pandas Series that represents the distribution of past configurations.
def make_config_dist(
    airport_code: str, airport_config_df: pd.DataFrame, normalize: bool = False
) -> pd.Series:
    config_timecourse = (
        airport_config_df.set_index("timestamp")
        .airport_config.resample("15min")
        .ffill()
        .dropna()
    )
    config_dist = config_timecourse.value_counts()
    if normalize:
        config_dist /= config_dist.sum()

    # prepend the airport code to the configuration strings
    prefix = pd.Series(f"{airport_code}:", index=config_dist.index)
    config_dist.index = prefix.str.cat(config_dist.index)

    return config_dist
Here's an example.
make_config_dist(airport_code, airport_config_df)
Censor data
Using the distribution of historic airport configurations is a great first step. However, we have to be careful that we don't use information from the future to predict the future. That would be cheating, since no real-time solution could know which configurations are common or uncommon in the future.
So, before we compute the distribution of configurations, we have to censor the data, cutting off everything that comes after the time when we are making the predictions.
As an example, let's get the actual configurations for the airport in the running example.
airport_config_df = airport_config_df_map[airport_code]
airport_config_df.head(10)
And let's suppose we are asked to make a prediction at 2020-11-01 05:00:00.
timestamp = pd.Timestamp("2020-11-01 05:00:00")
timestamp
We are only allowed to use data from before the prediction timestamp.
mask = airport_config_df["timestamp"] <= timestamp
mask.sum()
subset = airport_config_df[mask]
subset
While we're at it, it will be useful to extract the last configuration from the label data, which should be the current configuration (at the point where we make the prediction).
current = subset.iloc[-1]
current["airport_config"]
The following function encapsulates these steps. It takes the complete list of configurations for a particular airport and the timestamp for the current prediction.
It returns the current configuration and the subset of configurations from prior to the timestamp.
def censor_data(
    airport_config_df: pd.DataFrame, timestamp: pd.Timestamp
) -> Tuple[str, pd.DataFrame]:
    mask = airport_config_df["timestamp"] <= timestamp
    subset = airport_config_df[mask]
    current = subset.iloc[-1].airport_config
    return current, subset
Here's an example.
censor_data(airport_config_df, timestamp)
Prediction based on data
Now we're ready to make predictions that actually use data. As a baseline strategy, I'll make a predictive distribution that's a weighted mixture of three distributions:
A uniform distribution that makes sure we give non-zero probability to all possible configurations,
The distribution of past configurations, and
A point mass on the current configuration.
Using the same prediction frame we've been using, we'll construct a DataFrame in which each component distribution is in a column. Then we'll sum the columns together and normalize the result to sum to 1. Let's start with the uniform distribution:
predictive_distribution = pd.DataFrame({"uniform": make_uniform(pred_frame)})
Next we have to censor the data so we're only using history, not future information.
first = pred_frame.iloc[0]
airport_code, timestamp, lookahead, _, _ = first
print(f"Airport code: {airport_code}")
print(f"Timestamp: {timestamp}")
print(f"Lookahead: {lookahead}")
airport_config_df = airport_config_df_map[airport_code]
current, subset = censor_data(airport_config_df, timestamp)
print(f"Current configuration: {current}")

subset.tail()
Here's the distribution of past configurations.
config_dist = make_config_dist(airport_code, subset, normalize=True)
config_dist
At this point, there might be configurations in uniform that are not present in the censored subset, so they don't appear in config_dist.
And there might be configurations in config_dist that don't appear in uniform because they've been grouped into other in the labels.
We can use reindex to look up each of the configurations in uniform in config_dist. At that point, the resulting series will have NaN values for those configurations not present in the censored subset and those that are grouped into other in the labels.
Then we allocate the values from config_dist that didn't get selected to other.
predictive_distribution["config_dist"] = config_dist.reindex(
    predictive_distribution.index
).fillna(0)

other = config_dist.sum() - predictive_distribution.config_dist.sum()
predictive_distribution.loc[f"{airport_code}:other", "config_dist"] += other
Add more probability mass to the current configuration.
predictive_distribution["current"] = 0  # initalize a column of zeros
predictive_distribution.loc[f"{airport_code}:{current}", "current"] = (
    1  # set the current configuration to 1
)
Finally, we'll combine the components and normalize the predictive distribution so it adds up to 1.
mixture = predictive_distribution.sum(axis=1)
predictive_distribution["mixture"] = mixture / mixture.sum()
Now let's look at the values of the three component probabilities and their mixture:
predictive_distribution
predictive_distribution.rename(
    columns={
        "uniform": "Uniform",
        "config_dist": "Past",
        "current": "Current",
        "mixture": "Mixture",
    }
).plot(kind="bar", subplots=(1, 4), figsize=(6, 8), sharex=True, legend=False)

plt.subplots_adjust(hspace=0.3)
plt.show()

If things have gone right, the index of predictive_distribution should be the same as the list of configurations in pred_frame.
np.array_equal(predictive_distribution.index.values, pred_frame["config"].values)
The following function combines all of this logic and adds in three parameters:
hedge: the weight assigned to the uniform distribution (which hedges our bets by giving some probability to all configurations).weight: the weight assigned to current configuration.discount_factor: how much to decrease the importance of the current configuration as the lookahead time increases.
The relationship between weight and discount_factor is:
discount = 1 - discount_factor * (lookahead / 360)
pred_dist[current_key] += weight * discount
For example, with weight=6 and discount_factor=0.66, the effective weight for the present configuration is close to 6 for small values of lookahead, and only 2 when lookahead is 360 minutes (6 hours).
Recency-weighted historical forecast
We'll name this model the Recency-weighted historical forecast since it predicts configurations that were historically prevalent, upweighting the current configuration based on how recently that configuration was in effect.
No change forecast
Parameterizing the model in this way makes it easy to generate one variation worth mentioning: the No change forecast. In the case where weight > hedge, both weight and hedge are very large, and discount_factor=0, we effectively ignore the past configuration distribution and predict no change from the current configuration for all lookaheads. We'll compute that version outside of this notebook and add it to the competition leaderboard as a benchmark score for comparison.
def make_prediction(
    pred_frame: pd.DataFrame,
    hedge: float = 1,
    weight: float = 6,
    discount_factor: float = 0.66,
) -> pd.Series:
    # start with a uniform distribution
    uniform = make_uniform(pred_frame) * hedge
    predictive_distribution = pd.DataFrame({"uniform": uniform})

    # select the data we're allowed to use
    first = pred_frame.iloc[0]
    airport_code, timestamp, lookahead, _, _ = first
    airport_config_df = airport_config_df_map[airport_code]
    current, subset = censor_data(airport_config_df, timestamp)

    # make the distribution of past configurations
    config_dist = make_config_dist(airport_code, subset, normalize=True)
    predictive_distribution["config_dist"] = config_dist.reindex(
        predictive_distribution.index
    ).fillna(0)
    other = config_dist.sum() - predictive_distribution.config_dist.sum()
    predictive_distribution.loc[f"{airport_code}:other", "config_dist"] += other

    # put some extra weight on the current configuration (or `other`)
    current_key = f"{airport_code}:{current}"
    if current_key not in pred_frame.config.values:
        current_key = f"{airport_code}:other"
    discount = 1 - discount_factor * (lookahead / 360)
    predictive_distribution["current"] = 0  # initalize a column of zeros
    predictive_distribution.loc[current_key, "current"] = weight * discount

    # combine the components and normalize the result
    mixture = predictive_distribution.sum(axis=1)
    predictive_distribution["mixture"] = mixture / mixture.sum()

    return predictive_distribution.mixture
Here's an example.
pred_dist = make_prediction(pred_frame)
pred_dist
Choose a training set
For the Open arena, we split one year of data into weeks and held out a subset of those weeks as a test set. The remainder is intended for model training. This train-test split assumes that individual weeks are independent of one another, which is almost certainly not the case; airport configuration is correlated over time. So if a week is in the test period and we train on the prior and subsequent weeks, we are likely to overestimate the model's performance when compared to the final evaluation set, which comes months after the end of the training data time range.
Since our model uses only three parameters (and we're not spending much time optimizing them), we aren't going to be too concerned with overfitting. To keep the airport/lookahead balance of the full dataset, we'll sample 10 prediction frames from each airport/lookahead combination in open_train_labels. Just remember: you should think carefully about how you split the data during model training and validation to maximize the chance your model will generalize to the final evaluation dataset.
training_samples = (
    open_train_labels.groupby(["airport", "lookahead"])
    .sample(100, random_state=17)
    .set_index(["airport", "timestamp", "lookahead"])
    .sort_index()
)

training_samples.head()
Check that we have 100 prediction frames from each airport/lookahead.
training_samples.groupby(["airport", "lookahead"]).size().unstack("lookahead")
training_labels = (
    open_train_labels.set_index(["airport", "timestamp", "lookahead"])
    .loc[training_samples.index]  # select the sampled timestamp/lookaheads
    .reset_index()
    .sort_values(["airport", "timestamp", "lookahead", "config"])
)

training_labels.head()
To contain the predictions, I'll make a new DataFrame with the same columns as training_labels, but with a new column for active set to np.nan.
predictions = training_labels.copy().assign(active=np.nan)
predictions.head()
Make all the predictions
Now I'll generate predictions for each prediction frame in predictions.
The following function iterates through the prediction frames in a given DataFrame and generates a predictive distribution for each.
Then it writes the results into the active column.
from tqdm import tqdm


def make_all_predictions(predictions: pd.DataFrame):
    """Predicts airport configuration for all of the prediction frames in a table."""
    all_preds = []
    grouped = predictions.groupby(["airport", "timestamp", "lookahead"], sort=False)
    for key, pred_frame in tqdm(grouped):
        airport, timestamp, lookahead = key
        pred_dist = make_prediction(pred_frame)
        assert np.array_equal(pred_dist.index.values, pred_frame["config"].values)
        all_preds.append(pred_dist.values)

    predictions["active"] = np.concatenate(all_preds)
I can run it with the sample of prediction frames I selected.
make_all_predictions(predictions)
Score it!
To compute the loss function, we can use sklearn.metrics.log_loss from scikit-learn.
First, we'll compute separate losses for each airport.
from sklearn.metrics import log_loss

scores = [
    log_loss(group["active"], predictions.loc[group.index, "active"])
    for airport, group in training_labels.groupby("airport")
]
scores
Some are better than others. The overall score that the competition uses is the mean of the individual airport losses. To see whether the score is consistent from one run to another, you can go back and change the random seed.
np.mean(scores)
Accuracy
Log loss does not lend it self to a very intuitive interpretation beyond "lower is better." Other metrics help you understand where your model excels or struggles, generating ideas for how to improve. Let's look into a few options, starting with accuracy, i.e., the percent of times the configuration with the highest predicted probability was the actual configuration. We expect the accuracy of our model to depend on airport and lookahead time, so let's compute accuracy separately for those groups. This is one of the ways the NASA research team reports the performance of their model. (Note that the time period of the data from the paper is not the same as the time period of the competition dataset, so you won't be able to compare scores directly.)
accuracy = []
for airport in sorted(training_labels.airport.unique()):
    airport_labels = training_labels.loc[training_labels.airport == airport]
    airport_predictions = predictions.loc[predictions.airport == airport]
    airport_predictions = (
        airport_predictions.pivot_table(
            index=["timestamp", "lookahead"], columns=["config"], values=["active"]
        )["active"]
        .idxmax(axis=1)
        .rename("active")
        .to_frame()
    )
    airport_labels = (
        airport_labels.pivot_table(
            index=["timestamp", "lookahead"], columns=["config"], values=["active"]
        )["active"]
        .idxmax(axis=1)
        .rename("active")
        .to_frame()
    )
    airport_predictions["correct"] = airport_predictions.active == airport_labels.active
    accuracy.append(
        airport_predictions.groupby("lookahead").correct.mean().rename(airport) * 100
    )

accuracy = pd.concat(accuracy, axis=1)
accuracy.index.rename("Lookahead (minutes)", inplace=True)
accuracy
axs = accuracy.plot(
    subplots=True, sharey=True, sharex=True, figsize=(12, 6), layout=(2, 5)
)
axs[-1][0].set_ylabel("Accuracy %")

for ax in axs.flatten():
    ax.annotate(
        f"{ax.lines[0].get_ydata()[-1]:0.0f}%",
        (ax.lines[0].get_xdata()[-1], ax.lines[0].get_ydata()[-1]),
        xytext=(-5, 15),
        textcoords="offset points",
        verticalalignment="center",
        horizontalalignment="center",
    )
    ax.annotate(
        f"{ax.lines[0].get_ydata()[0]:0.0f}%",
        (ax.lines[0].get_xdata()[0], ax.lines[0].get_ydata()[0]),
        xytext=(15, -5),
        textcoords="offset points",
        verticalalignment="center",
        horizontalalignment="center",
    )
axs[0][0].figure.suptitle("Accuracy by lookahead")
plt.show()

As you can see, for most airports it is pretty easy to predict the active configuration an 30 minutes from the present. However at larger lookaheads, accuracy varies a lot by airport. Part of the challenge will be finding a model that works well across all airports and for later lookahead times.
The overall accuracy is the mean. Since we have the same number of samples for each airport/lookahead, we can compute the overall accuracy as the mean of the individual airport/lookahead accuracies.
print(f"Overall accuracy: {accuracy.values.mean():2.2f}%")
Evaluating on changes only
Airport reconfigurations are relatively rare; most of the time, the configuration stays the same. This is partly why a model that only knows the distribution of historical configurations and the current configuration can do pretty well at this task. To really put our model to the test, we can look at how well it performs when evaluated only on prediction frames for which the true configuration is not the same as the current configuration. Let's see how model performance for this only change dataset. We'll use a slight variation of accuracy, "top k" accuracy, where a configuration is marked as correct if it is among the first k most probable configurations.
def compute_airport_top_k_accuracy(
    airport_predictions: pd.DataFrame,
    config_timecourse: pd.Series,
    k: int,
    only_change: bool = False,
) -> float:
    """Computes top k accuracy for a single airport"""
    airport = airport_predictions.iloc[0].airport
    airport_configs = airport_predictions.config.unique()
    top_k_hits = []
    for (timestamp, lookahead), group in airport_predictions.groupby(
        ["timestamp", "lookahead"]
    ):
        lookahead_config = config_timecourse.loc[
            timestamp + pd.Timedelta(minutes=lookahead)
        ]

        if lookahead_config not in airport_configs:
            lookahead_config = f"{airport}:other"

        if only_change:
            # only include samples where a configuration change occurred
            current_config = config_timecourse.loc[timestamp]
            include = current_config != lookahead_config
        else:
            include = True
        if include:
            top_k_predictions = group.sort_values("active", ascending=False).config.iloc[
                :k
            ]
            top_k_hits.append(
                {
                    "lookahead": lookahead,
                    "hit": lookahead_config in top_k_predictions.values,
                }
            )

    return pd.DataFrame(top_k_hits).groupby("lookahead").hit.mean()
def compute_top_k_accuracy(ks: Sequence[int], only_change: bool):
    """Iterates over airports to compute overall top k accuracy"""
    top_ks = {}
    for k in ks:
        airport_top_ks = []
        for airport in predictions.airport.unique():
            config_timecourse = (
                airport_config_df_map[airport]
                .set_index("timestamp")
                .airport_config.resample("30min")
                .ffill()
                .dropna()
            )
            config_timecourse = f"{airport}:" + config_timecourse
            airport_predictions = predictions.loc[predictions.airport == airport]
            airport_top_k = compute_airport_top_k_accuracy(
                airport_predictions, config_timecourse, k=k, only_change=only_change
            )
            airport_top_k.rename(airport, inplace=True)
            airport_top_ks.append(airport_top_k)
        top_ks[k] = pd.concat(airport_top_ks, axis=1).values.mean()

    return pd.Series(
        top_ks.values(), name="accuracy", index=pd.Index(top_ks.keys(), name="k")
    )
top_k_all = compute_top_k_accuracy((1, 3, 5), only_change=False)
top_k_only_change = compute_top_k_accuracy((1, 3, 5), only_change=True)
top_k = (
    pd.concat([top_k_all, top_k_only_change], keys=("All", "Only change"), axis=1) * 100
)
ax = top_k.rename(index={k: f"$k={k}$" for k in top_k.index}).plot(kind="bar")
ax.set_ylabel("Top $\it{k}$ accuracy")
ax.set_xlabel("")
ax.yaxis.set_major_formatter(mpl.ticker.PercentFormatter(decimals=0))

You can see here how much the performance of our simple model relies on the fact that airport reconfigurations are relatively rare! When we evaluate our model on frames for which the future configuration is not the same as the current configuration, we see that our model does quite poorly.
Generate a submission
Now let's generate a submission for the competition. First we'll read the submission file to see which prediction frames we're supposed to generate.
submission_format = pd.read_csv(
    DATA_PATH / "open_submission_format.csv", parse_dates=["timestamp"]
)
print(f"{len(submission_format):,} rows x {len(submission_format.columns)} columns")
submission = submission_format.copy()
submission["active"] = np.nan
submission.head()
submission.tail()
And generate predictions.
make_all_predictions(submission)
Before submitting it is a good idea to check that our submission conforms to the submission format.
submission[["airport", "timestamp", "lookahead", "config"]].equals(
    submission_format[["airport", "timestamp", "lookahead", "config"]]
)
And double check that the predictions for each airport, timestamp, and lookahead combination sum to one.
np.allclose(submission.groupby(["airport", "timestamp", "lookahead"]).sum(), 1)
Finally, we can write the predictions to a CSV file ready to submit to the competition. Note the use of the date_format argument to pd.DataFrame.to_csv; that ensures that dates are stored in the correct format, e.g., "2021-01-01T12:00:00". Also consider submitting a zipped CSV, which can result in a much smaller file and much faster uploads. A valid zipped submission contains a single CSV file, which we can achieve with the compression argument to pd.DataFrame.to_csv.
filename = "submission.csv.zip"

submission.to_csv(
    filename,
    date_format="%Y-%m-%dT%H:%M:%S",
    index=False,
    compression={"method": "zip", "archive_name": "submission.csv"},
)
!ls -lh submission.csv.zip
Let's load the actual submission CSV and check the first few lines to make sure the file is in the right format.
pd.read_csv(filename, parse_dates=["timestamp"], nrows=5)
And here is how the submission appears on the competition submissions page:

The test subset score of 0.0980 is pretty close to the training subset score of 0.0976, which is a good sign that the subsets do not have wildly different distributions.
We added this submission (Recency-weighted historical forecast) and the No change forecast as benchmarks on the competition leaderboard so you can compare your models to them throughout the competition.

That concludes our benchmark! There is tons of potential for iterating on this approach and for completely new solutions. We haven't even cracked open the other features, like flight-level air traffic streams and historical weather predictions. Head on over to competition to get started. We're excited to see what you build!
Banner image courtesy of Michael Coghlan.