case studies

Making higher education data more accessible

DrivenData partnered with Science for America to develop scipeds, an open source Python library and interactive data visualization platform designed to simplify the analysis of U.S. higher education data from IPEDS and to illuminate trends and disparities in STEM education.

The organization

Science for America is a solutions incubator that brings together scientists, technologists, and cross-sector partners to develop game-changing initiatives addressing critical societal challenges. By fostering collaborations and supporting data-driven tools, they aim to drive systemic improvements in climate & energy, health & medicine, and STEM equity & education.

The challenge

The Integrated Postsecondary Education Data System (IPEDS) offers a wealth of comprehensive data on U.S. higher education institutions, including data on degree completions by field, race/ethnicity, gender, and institution. However, this data and the codes used to represent and classify different educational fields are spread across numerous files and formats that have changed over time, making it difficult to conduct longitudinal or comparative analyses.

While working to understand representation in STEM education, Science for America surfaced the need for a more accessible and structured way to work with IPEDS data. A streamlined solution would allow educators, advocates, and researchers to better understand who is earning STEM degrees, where, and how that has changed over time.

The approach

To meet this need, Science for America partnered with DrivenData to create scipeds, an open source Python library that simplifies working with IPEDS data.

scipeds provides:

  • A reproducible data processing pipeline that standardizes and organizes decades of IPEDS survey data into a centralized DuckDB database.
  • Python query engines that enable users to run common analyses without writing any SQL.
  • Support for core IPEDS components from 1984 to 2023, including completions by field, degree type, race/ethnicity, and gender.

This library provides tools for users to quickly query data with a stable schema across years, enabling reliable, reproducible analyses.

The results

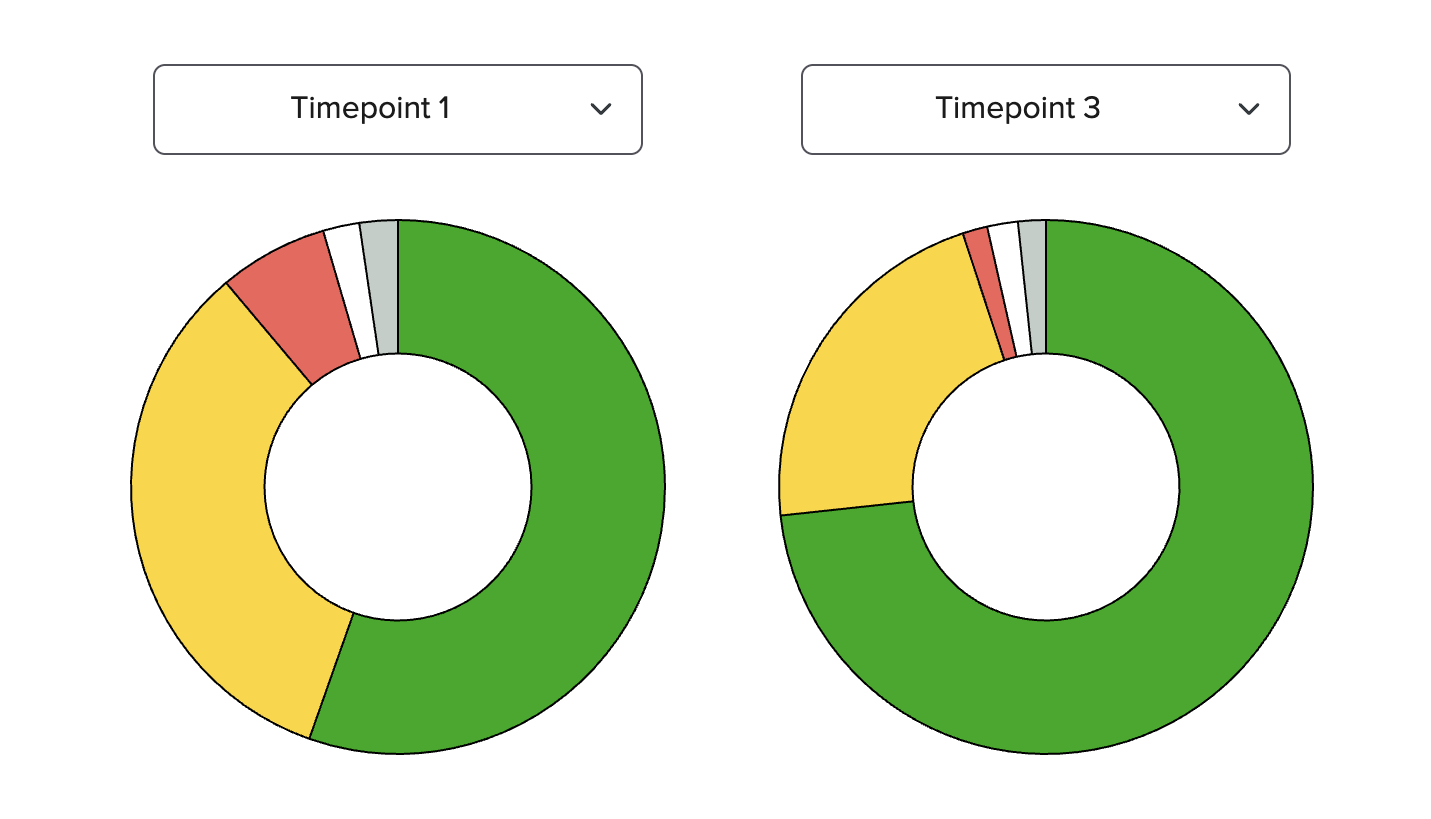
To make IPEDS data even more accessible to those without any programming or data analysis experience, the team built a companion interactive visualization platform that leverages the scipeds library to power real-time interactive data analysis.

Screenshot of a data visualization from the scipeds interactive platform showing the distribution of relative representation of women in STEM at different universities and the first several rows of a detailed table.

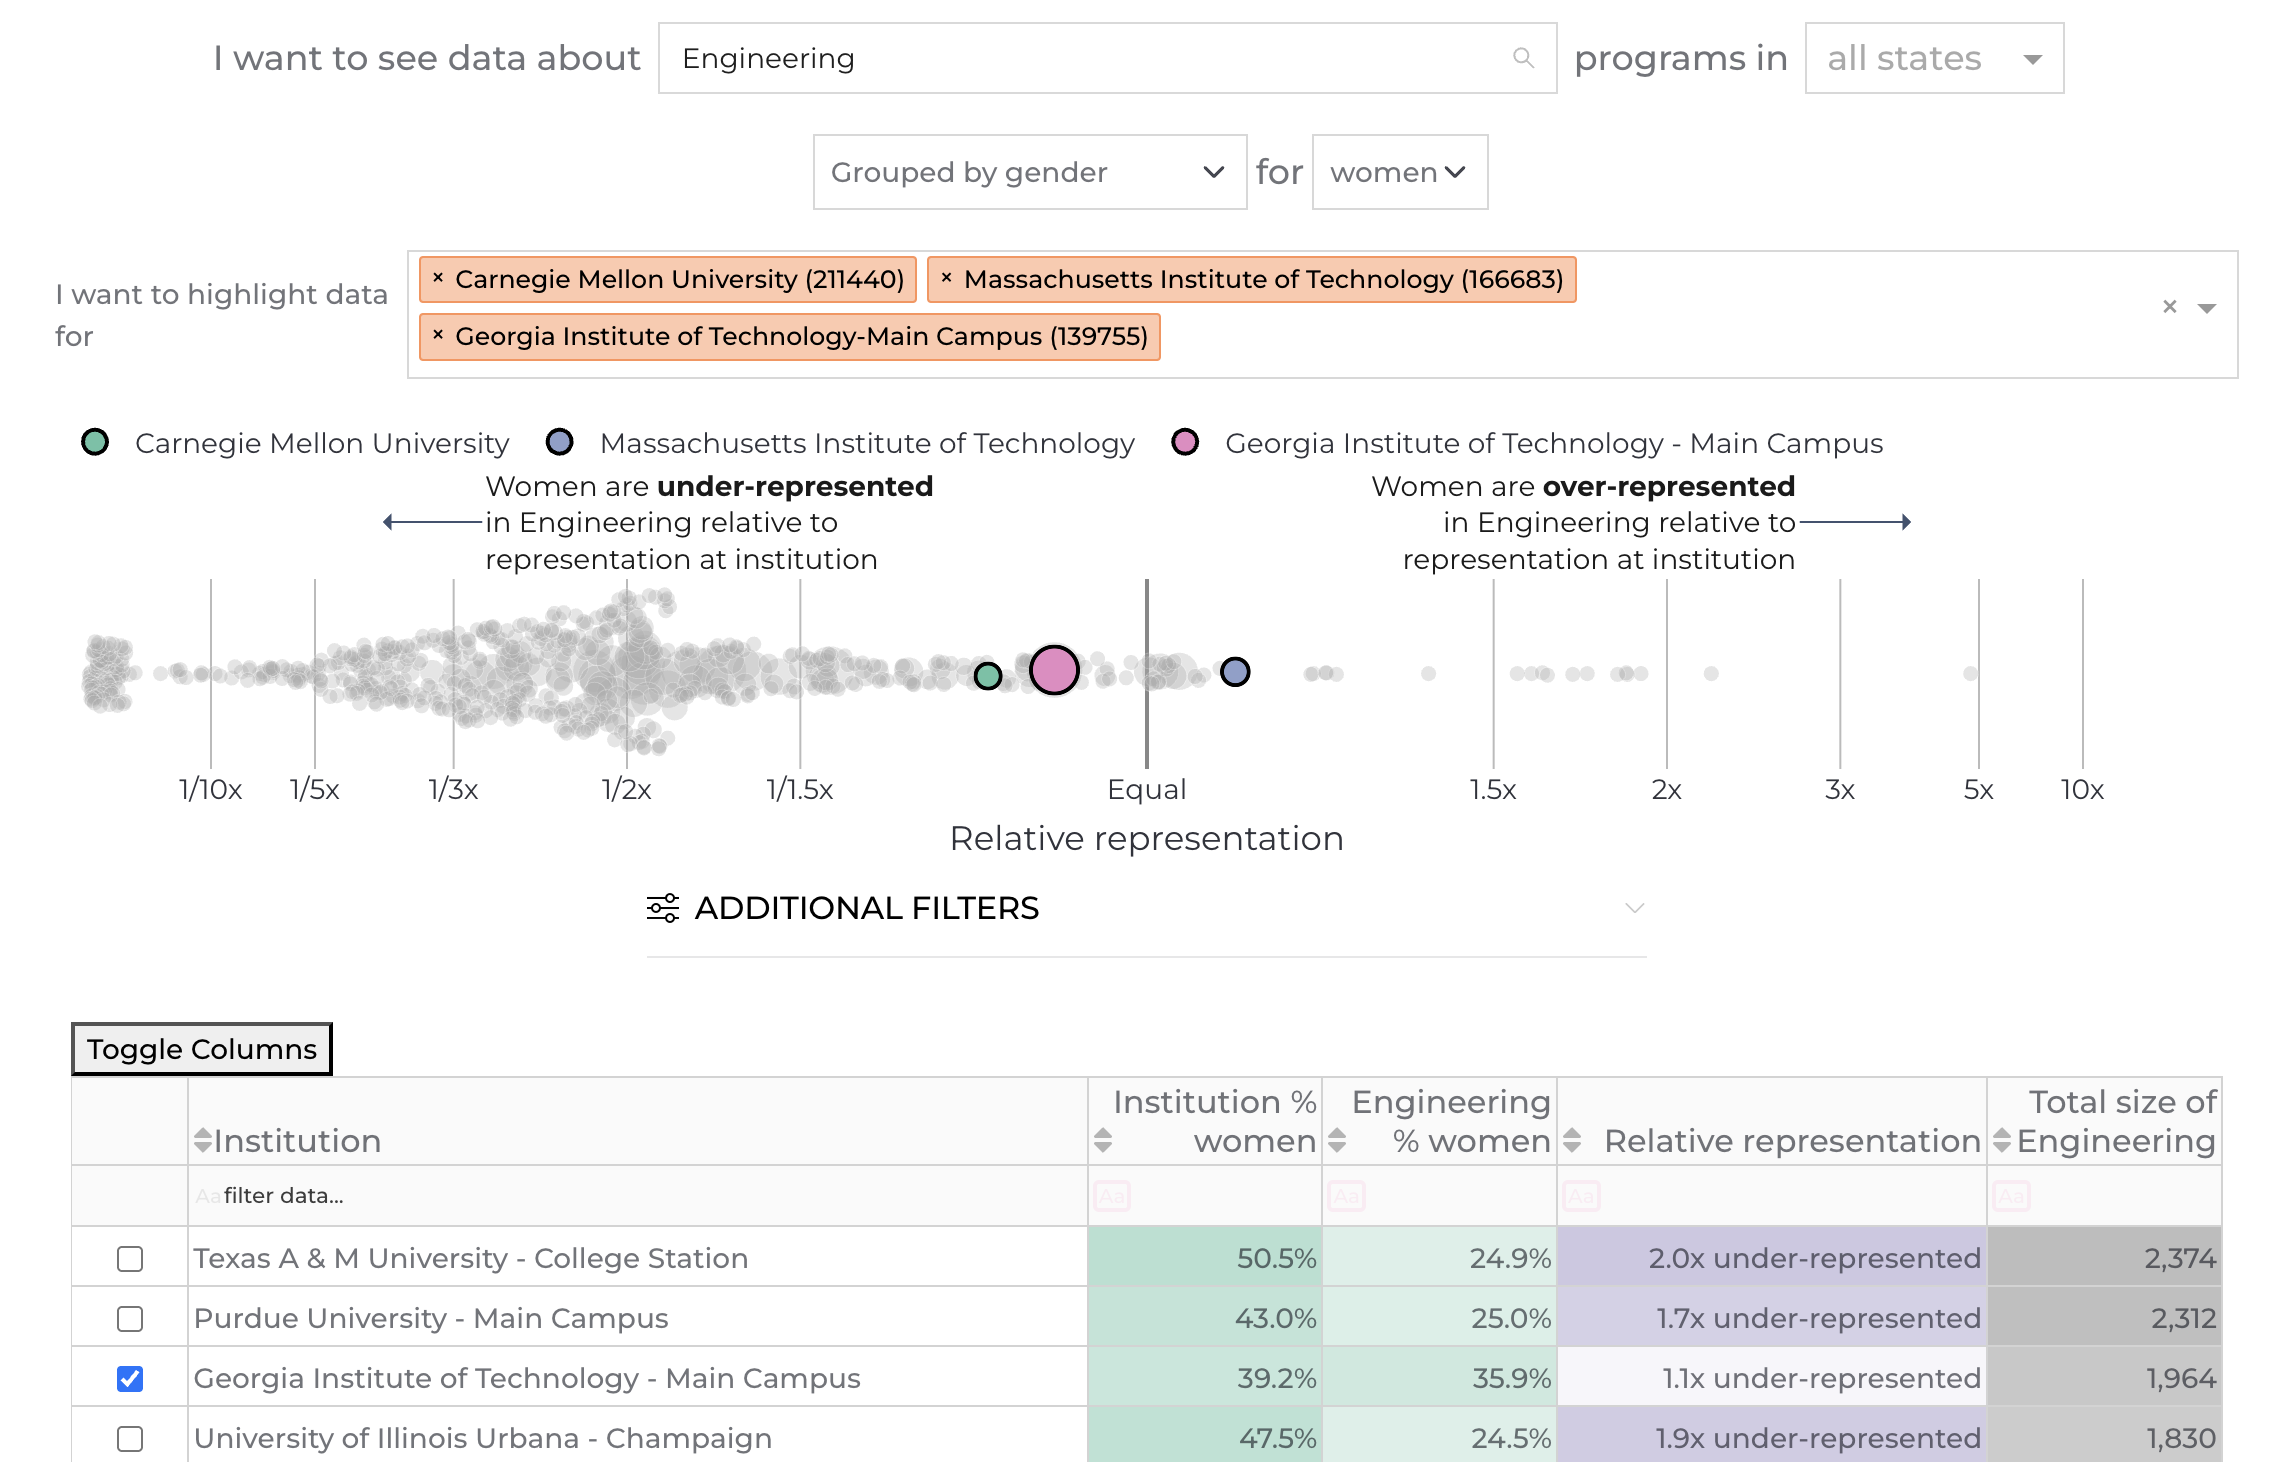
The Fields page of the scipeds interactive data visualization platform.


The interactive platform contains pages with visualizations designed for specific audiences that highlight IPEDS data in different ways:

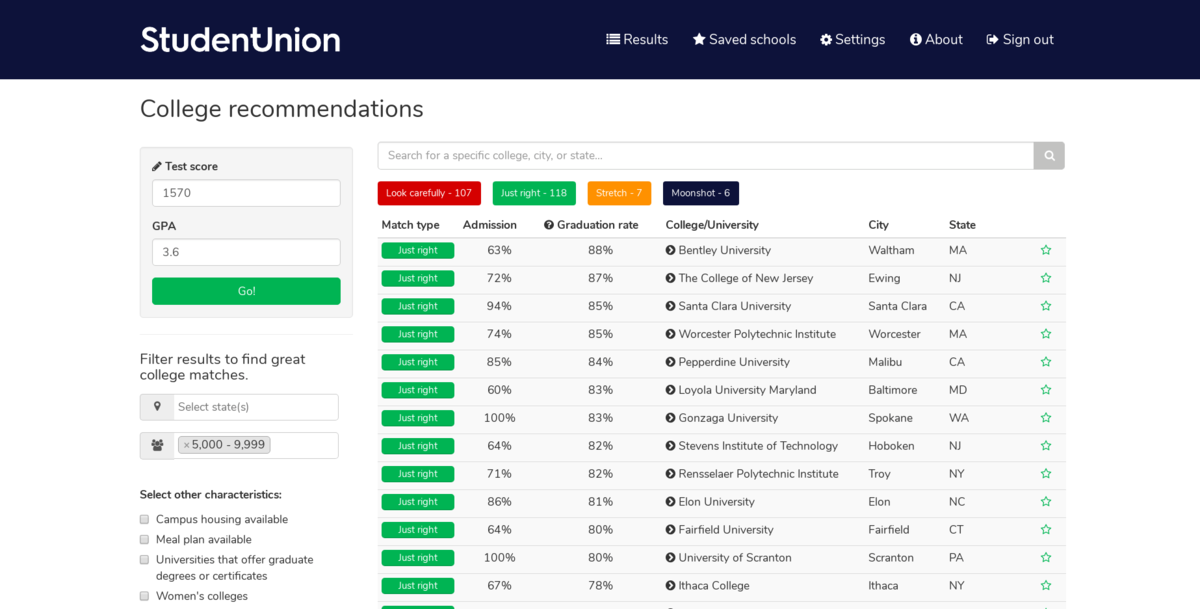
  • Students and families can explore how representation varies by race, gender, and field of study to make informed decisions about where to apply.
  • Faculty and administrators can benchmark their institutions against national trends and peer schools to understand disparities and opportunities for progress.
  • Researchers and advocates can dive deep into custom queries using the data sandbox for exploratory analysis and hypothesis testing.

Together, these tools help a variety of users better understand the current state of higher STEM education in the U.S. and make informed decisions about their own actions.

To learn more, visit the documentation, try out the library, or explore the interactive site.

Our real-world impact

All projects
Partners: Max Planck Institute for Evolutionary Anthropology, Arcus Foundation, WILDLABS

Automating wildlife identification for research and conservation

Detected wildlife in images and videos—automatically and at scale—by building the winning algorithm from a DrivenData competition into an open source python package and a web application running models in the cloud.

Partners: Private sector, social sector

Building LLM solutions

Built solutions using LLMs for multiple real-world applications, across tasks including semantic search, summarization, named entity recognition, and multimodal analysis. Work has spanned research on state-of-the-art models tuned for specific use cases to production ready retrieval-augmented AI applications.

Partners: The World Bank, The Conflict and Environment Observatory

Identifying crop types using satellite imagery in Yemen

Used satellite imagery to identify crop extent, crop types and climate risks to agriculture in Yemen, informing World Bank development programs in the country after years of civil war.

Partners: Bureau of Ocean Energy Management, NOAA Fisheries, Wild Me

Protecting endangered beluga whales with computer vision

Designed and administered a computer vision challenge that produced state-of-the-art machine learning models to identify and match individual endangered beluga whales from photo surveys.

Partners: EverFree

A production application to support survivors of human trafficking

Built the Freedom Lifemap platform, a digital tool designed to support survivors of human trafficking on their journey toward reintegration and independence

Partners: ReadNet

Crowdsourcing solutions for AI assisted early literacy screening

Ran a machine learning challenge to develop automatic scoring methods for audio clips from literacy screener exercises. Automated scoring can help teachers quickly and reliably identify children in need of early literacy intervention.

Partners: Science for America

Making higher education data more accessible

Created an open source Python library and interactive data visualization platform for analyzing U.S. higher education data and illuminating trends and disparities in STEM education.

Partners: IDEO.org

Illuminating mobile money experiences in Tanzania

Analyzed millions of mobile money records to uncover patterns in behavior, and then combined these insights with human-centered design to shape new approaches to delivering mobile money to low-income populations in Tanzania.

Partners: Insecurity Insight, Physicians for Human Rights

Tracking attacks on health care in Ukraine

Built a real-time, interactive map to visualize attacks on the Ukrainian health care system since the Russian invasion began in February of 2022. The map will support partner efforts to provide aid, hold aggressors accountable in court, and increase public awareness.

Partners: Wellcome

Addressing algorithmic bias in medical research

Conducted a literature review to understand the current state of bias identification & mitigation in mental health research, and synthesized recommended best practices from the field of machine learning.

Partners: CABI Plantwise

Mining chat messages with plant doctors using language models

Automated recognition of agricultural entities (such as crops, pests, diseases, and chemicals) in WhatsApp and Telegram messages among plant doctors, enabling new ways to surface emerging trends and improve science-based guidance for smallholder farmers.

Partners: NASA

Monitoring water quality from satellite imagery

Created an open-source package to detect harmful algal blooms using machine learning and satellite imagery. Included running a machine-learning competition, conducting end user interviews, and engineering a robust, deployable pipeline.

Partners: Data science company foundation

Matching students with schools where they are likely to succeed

Used machine learning to match students with higher education programs where they are more likely to get in and graduate based on their unique profile, with a focus on backgrounds traditionally less likely to attend college or apply to more competitive programs.

Partners: Fair Trade USA

Mapping fair trade products from source to shelf

Visualized the flow of fair trade coffee products from the farms where they are grown to the stores where they are sold, connecting the nodes in supply chain transactions and increasing transparency for customers and auditors.

Partners: University of Maryland

Processing multimodal tutoring data

Built well-engineered data pipelines to extract machine learning features from audio, video and transcript data collected from online tutoring sessions, enabling a team at the University of Maryland to study how relationship-building affects student outcomes.

Partners: The World Bank, Angaza, GOGLA, Lighting Global

Developing performance indicators and repayment models in off-grid solar

Analyzed repayment behaviors across dozens of pay-as-you-go (PAYG) solar energy companies serving off-grid populations throughout Africa, and developed KPIs to facilitate standardized reporting for PAYG portfolios.

Partners: Haystack Informatics

Modeling patient pathways through hospitals

Mapped out the probabilistic patient journeys through hospitals based on tens of thousands of patient experiences, giving hospitals a better view into the timing of the activities in their departments and how they relate to operational efficiency.

Partners: Yelp, Harvard University, City of Boston

Predicting public health risks from restaurant reviews

Flagged public health risks at restaurants by combining Yelp reviews with open city data on past inspections. An algorithmic approach discovers 25% more violations with the same number of inspections.

Partners: Education Resource Strategies

Smart auto-tagging of K-12 school spending

Built algorithms that put apples-to-apples labels on school budget line items so that districts understand how their spending stacks up and where they can improve, saving months of manual processing each year.

Partners: Love Justice

Building data tools to fight human trafficking in Nepal

Aided anti-trafficking efforts at border crossings and airports by combining data across locations and surfacing insights that give interviewers greater intelligence about the right questions to ask and how to direct them.

Work with us to build a better world

Learn more about how our team is bringing the transformative power of data science and AI to organizations tackling the world's biggest challenges.