case studies

Mapping agricultural trends in Yemen during crisis

DrivenData partnered with The World Bank to use machine learning and remote sensing data to track agricultural changes across Yemen from 2019-2024, providing critical insights for food security planning in a conflict-affected region.

The organization

The World Bank works to reduce poverty and support development around the world, with a particular focus on fragile and conflict-affected situations. In Yemen, the organization supports programs for food and nutrition security in one of the world's most challenging humanitarian contexts, where traditional data collection methods are often impossible due to ongoing conflict.

The challenge

Yemen faces a severe humanitarian crisis, with food security significantly impacted by conflict and climate change. Understanding the evolution and current state of agriculture across the entire country—spanning over 500,000 square kilometers—is critical for informing World Bank and other donor support programs for food and nutrition security. However, agricultural data in Yemen is not readily available and is extremely difficult to collect through traditional on-the-ground surveys. Alternative approaches using remote sensing data were needed to provide timely, accurate information for food security planning and response across all 22 governorates.

The approach

DrivenData collaborated with The World Bank to develop an innovative machine learning approach that used publicly available remote sensing data to track agricultural trends across all of mainland Yemen over a six-year period (2019-2024). Our comprehensive methodology scaled from detailed site analysis to country-wide inference, processing millions of satellite pixels monthly.

The project began with expert remote labeling of over 210 square kilometers of high-resolution satellite imagery across eight strategically selected sites representing Yemen's diverse agro-ecological zones. Using this training data, we developed multi-temporal machine learning models that could process Sentinel-2 satellite data at 10-meter resolution across the entire country.

Our hierarchical crop classification system distinguished between many different agricultural categories including cereals, qat, coffee, orchards, fodder, greenhouses, and mixed crops, generating country-wide predictions for each year. The technical approach used multi-pixel models processing 12 months of satellite data with NDVI differences, incorporated elevation data alongside five spectral bands, and applied Google Earth Engine's pixel quality algorithms for robust cloud filtering across the massive scale of analysis.

The inference challenge was substantial: generating annual predictions for active cropland and crop types across millions of 10-meter pixels covering all agricultural areas of Yemen, then aggregating these pixel-level predictions to meaningful administrative units for policy analysis. Significant effort went into scaling inference so that the required 27 billion predictions could be performed in a reasonable amount of time.

The results

The country-wide analysis revealed that actively cultivated cropland in Yemen increased substantially between 2019 and 2024, with peak activity levels reaching approximately twice the total area cultivated in 2019—representing over 1.3 million hectares of active agriculture by 2024. The team successfully generated predictions across all 333 districts in Yemen, finding that agricultural activity varied significantly from year to year, with changes most strongly correlated with rainfall patterns.

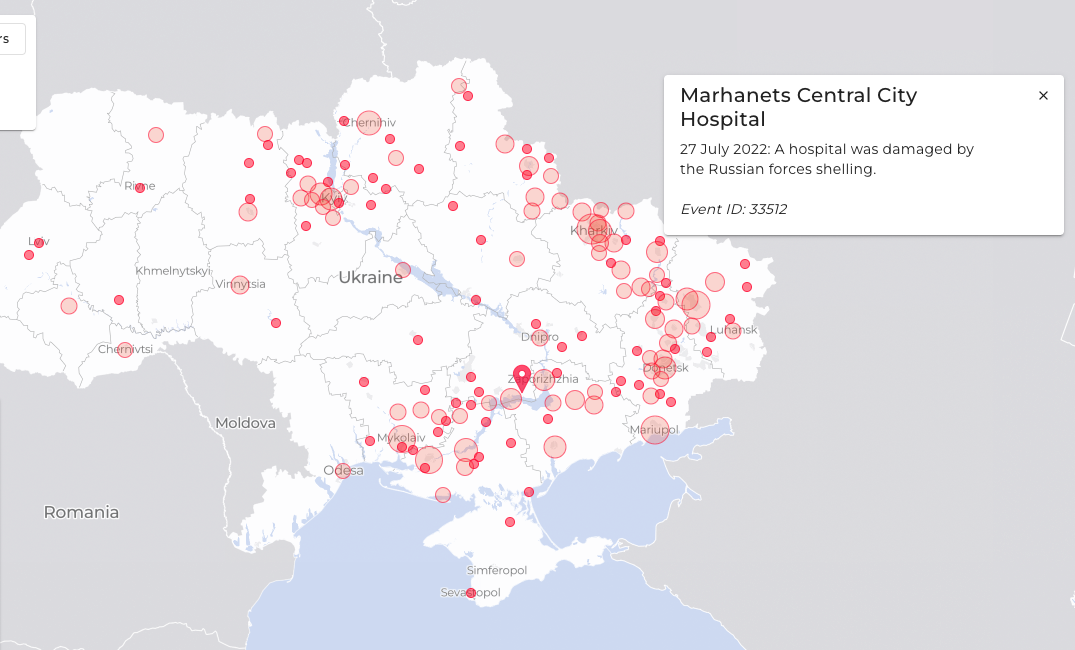
The scale of insights was unprecedented for Yemen: detailed crop type maps showing that qat comprises a large share of agricultural land, cereals dominating the agricultural landscape with over 600,000 hectares in peak years, and clear regional patterns in agricultural intensity and crop selection. While conflict impacts were visible in specific locations like Al Jawf governorate, the aggregate analysis across all districts showed weaker associations between agriculture and factors like conflict severity, food security, population density, and wealth at the governorate level.

Animation of active agriculture predictions over time in the Al Jawf governorate.

Animation of active agriculture predictions over time in the Al Jawf governorate, showing an apparent increase in actively cultivated land area as the front line of conflict moves southeast.

These findings provide crucial evidence for policy makers and humanitarian organizations working on food security in Yemen. The maps and trend analyses created through this project lay the foundation for more targeted interventions and continued monitoring of agricultural resilience in conflict-affected areas. The methodology developed can be applied to other fragile contexts where traditional agricultural data collection is challenging or impossible, potentially covering millions of square kilometers across conflict-affected regions globally.

Our real-world impact

All projects
Partners: CodePath

Data engineering from the ground up

Built data infrastructure to ingest, clean, integrate, and organize data across CodePath, created interactive dashboards for accurate monitoring of program trends, and provided trusted data expertise to identify and hire talent to carry the work forward.

Partners: The National Center for State Courts

Building a private LLM sandbox for NCSC

We worked with the National Center for State Courts to build an LLM chat sandbox for private usage. This sandbox allows users to experiment with LLM tools in a way that is safe, secure, and cost-effective, with specific use cases and prompts relevant to their work.

Partners: Max Planck Institute for Evolutionary Anthropology, Arcus Foundation, WILDLABS

Automating wildlife identification for research and conservation

Detected wildlife in images and videos—automatically and at scale—by building the winning algorithm from a DrivenData competition into an open source python package and a web application running models in the cloud.

Partners: The World Bank, The Conflict and Environment Observatory

Identifying crop types using satellite imagery in Yemen

Used satellite imagery to identify crop extent, crop types and climate risks to agriculture in Yemen, informing World Bank development programs in the country after years of civil war.

Partners: Private sector, social sector

Building applied solutions with LLMs

Built solutions using LLMs for multiple real-world applications, across tasks including semantic search, summarization, named entity recognition, and multimodal analysis. Work has spanned research on state-of-the-art models tuned for specific use cases to production ready retrieval-augmented AI applications.

Partners: Bureau of Ocean Energy Management, NOAA Fisheries, Wild Me

Protecting endangered beluga whales with computer vision

Designed and administered a computer vision challenge that produced state-of-the-art machine learning models to identify and match individual endangered beluga whales from photo surveys.

Partners: EverFree

A production application to support survivors of human trafficking

Built the Freedom Lifemap platform, a digital tool designed to support survivors of human trafficking on their journey toward reintegration and independence

Partners: ReadNet

Crowdsourcing solutions for AI assisted early literacy screening

Ran a machine learning challenge to develop automatic scoring methods for audio clips from literacy screener exercises. Automated scoring can help teachers quickly and reliably identify children in need of early literacy intervention.

Partners: Science for America

Making higher education data more accessible

Created an open source Python library and interactive data visualization platform for analyzing U.S. higher education data and illuminating trends and disparities in STEM education.

Partners: IDEO.org

Illuminating mobile money experiences in Tanzania

Analyzed millions of mobile money records to uncover patterns in behavior, and then combined these insights with human-centered design to shape new approaches to delivering mobile money to low-income populations in Tanzania.

Partners: Insecurity Insight, Physicians for Human Rights

Tracking attacks on health care in Ukraine

Built a real-time, interactive map to visualize attacks on the Ukrainian health care system since the Russian invasion began in February of 2022. The map will support partner efforts to provide aid, hold aggressors accountable in court, and increase public awareness.

Partners: Wellcome

Addressing algorithmic bias in medical research

Conducted a literature review to understand the current state of bias identification & mitigation in mental health research, and synthesized recommended best practices from the field of machine learning.

Partners: CABI Plantwise

Mining chat messages with plant doctors using language models

Automated recognition of agricultural entities (such as crops, pests, diseases, and chemicals) in WhatsApp and Telegram messages among plant doctors, enabling new ways to surface emerging trends and improve science-based guidance for smallholder farmers.

Partners: NASA

Monitoring water quality from satellite imagery

Created an open-source package to detect harmful algal blooms using machine learning and satellite imagery. Included running a machine-learning competition, conducting end user interviews, and engineering a robust, deployable pipeline.

Partners: Data science company foundation

Matching students with schools where they are likely to succeed

Used machine learning to match students with higher education programs where they are more likely to get in and graduate based on their unique profile, with a focus on backgrounds traditionally less likely to attend college or apply to more competitive programs.

Partners: Fair Trade USA

Mapping fair trade products from source to shelf

Visualized the flow of fair trade coffee products from the farms where they are grown to the stores where they are sold, connecting the nodes in supply chain transactions and increasing transparency for customers and auditors.

Partners: University of Maryland

Processing multimodal tutoring data

Built well-engineered data pipelines to extract machine learning features from audio, video and transcript data collected from online tutoring sessions, enabling a team at the University of Maryland to study how relationship-building affects student outcomes.

Partners: The World Bank, Angaza, GOGLA, Lighting Global

Developing performance indicators and repayment models in off-grid solar

Analyzed repayment behaviors across dozens of pay-as-you-go (PAYG) solar energy companies serving off-grid populations throughout Africa, and developed KPIs to facilitate standardized reporting for PAYG portfolios.

Partners: Haystack Informatics

Modeling patient pathways through hospitals

Mapped out the probabilistic patient journeys through hospitals based on tens of thousands of patient experiences, giving hospitals a better view into the timing of the activities in their departments and how they relate to operational efficiency.

Partners: Yelp, Harvard University, City of Boston

Predicting public health risks from restaurant reviews

Flagged public health risks at restaurants by combining Yelp reviews with open city data on past inspections. An algorithmic approach discovers 25% more violations with the same number of inspections.

Work with us to build a better world

Learn more about how our team is bringing the transformative power of data science and AI to organizations tackling the world's biggest challenges.