The Challenge
"Finding the correct matches can take humans a lot of time, as they often have to look through hundreds of photos. We are excited to start using the winning models and anticipate this will speed up our work flow substantially. We will be able to get the results of our annual surveys out to the public and managers much more rapidly so that conservation efforts can be based on the most recent information."
Paul Wade, NOAA Fisheries Research Biologist and lead for NOAA’s research on Cook Inlet Belugas
Motivation

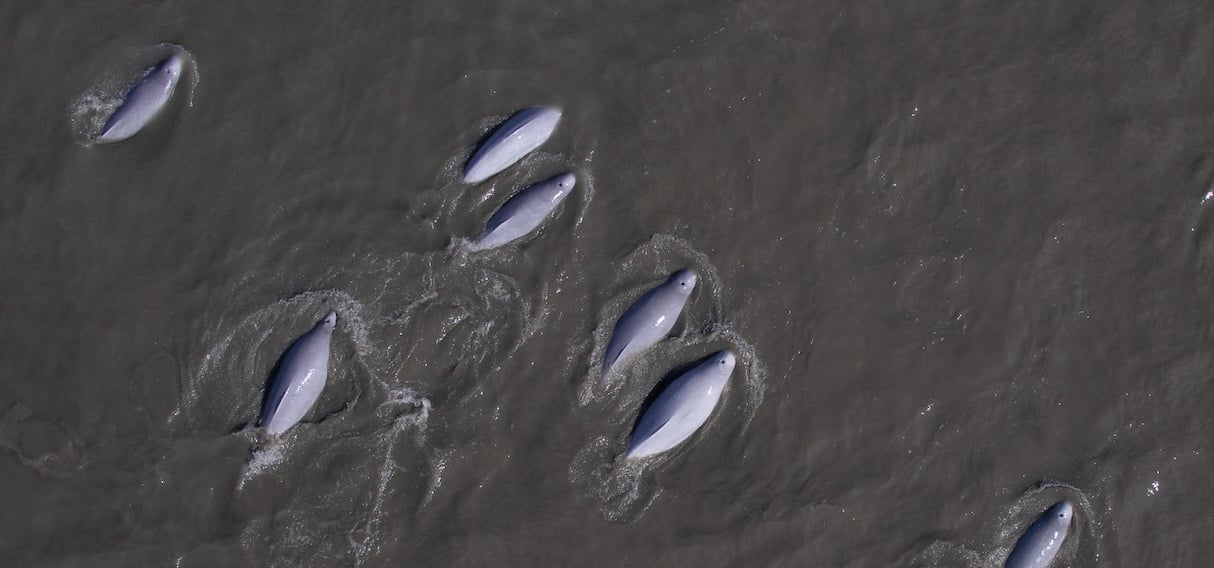
In the muddy waters of Cook Inlet, Alaska, an endangered population of beluga whales is trying to make a comeback. Years of hunting have depleted the population, and although most hunting has been banned since the late 1990s, a number of other threats, including the heavy shipping traffic and resulting ocean noise in this area, still hinder recovery. It is estimated that this unique and isolated group of whales consists of less than 300 individuals. But we're not exactly sure about that number—that's where this challenge comes in.
In recent years, conservationists have been exploring the use of machine learning to help in their work, often applying computer vision techniques to large datasets of images, like those from camera traps, or in this case from overhead drones and vessels. The data in this challenge comes from the Marine Mammal Laboratory at the NOAA Alaska Fishery Science Center, a group that has been conducting annual photo-identification surveys of Cook Inlet belugas.
In many cases, these techniques can be less invasive, expensive or laborious than traditional research techniques such as physical tagging an animal. One task that they can help with is animal re-identification, in which a model learns to identify new images of the same individual, which wildlife researchers can then use to make estimates about population size and health.
The Where's Whale-do challenge invited participants to help wildlife researchers by developing models to accurately identify individual Cook Inlet beluga whales from photographic images. Let's see how it went.
Results
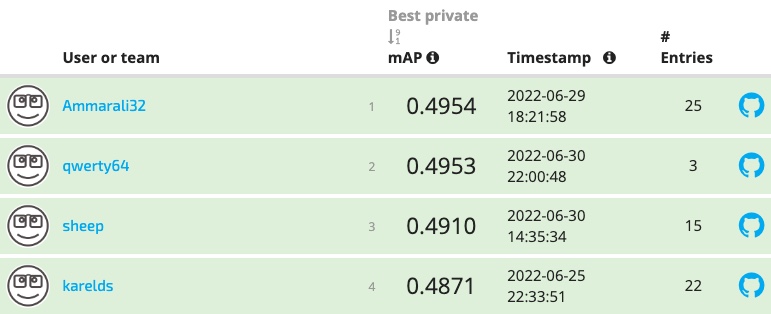
This challenge received over 1,000 submissions over the course of two months. The simplistic benchmark solution we provided was quickly surpassed in the early weeks by a pair of submissions that used pre-trained facial recognition models and achieved ~0.3 mean average precision (mAP). These were gradually improved upon over the remainder of the competition, with the prize winners ultimately reaching scores of ~0.5 mAP on the unseen test dataset.
All submissions were scored against a test dataset that consisted of 10 scenarios. We can now reveal in a little more detail what those scenarios looked like.
| Scenario | # queries | Database size | Notes | Avg finalist score |
|---|---|---|---|---|
| 1 | 1,208 | 3,290 | Top-view test images against all top-view images | 0.45 |
| 2 | 592 | 633 | Top-view new whales with multiple images against top-view new whales | 0.50 |
| 3 | 616 | 2,041 | Top-view new images of training set whales against all top-view training images | 0.50 |
| 4 | 300 | 1,110 | Top-view 2017 test images against all 2017 top-view images | 0.50 |
| 5 | 346 | 971 | Top-view 2018 test images against all 2018 top-view images | 0.68 |
| 6 | 562 | 1,209 | Top-view 2019 test images against all 2019 top-view images | 0.52 |
| 7 | 562 | 403 | Top-view 2019 test images against all 2018 top-view images with same whales | 0.62 |
| 8 | 562 | 338 | Top-view 2019 test images against all 2017 top-view images with same whales | 0.57 |
| 9 | 102 | 318 | Lateral-view new whales against top-view new whales with lateral images | 0.22 |
| 10 | 309 | 111 | Top-view new whales with lateral images against lateral-view new whales | 0.29 |
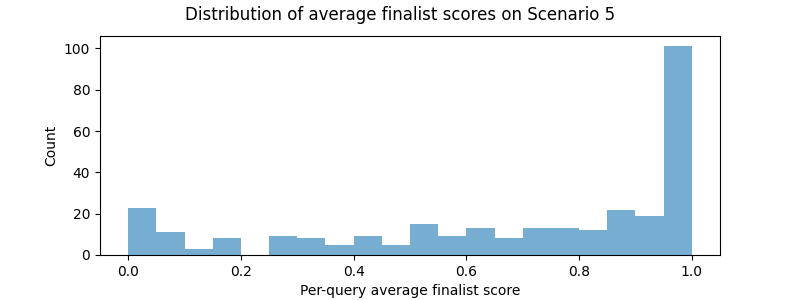
Performance was not uniform across scenarios. Some scenarios, such as Scenarios 5, 7 and 8 were relatively easy, as the distribution of finalists' average AP scores by query shows below.
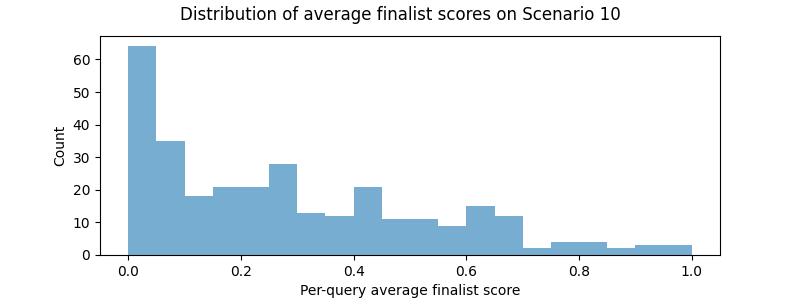
Scenarios 9 and 10, in which top-view images needed to be ranked using only a lateral view image, or vice versa, were considerably more difficult (see the Problem Description for more background on top vs lateral-view images). In addition to having to deal with a differing view in query and database, there were not many lateral-view images in the training set, making these scenarios particularly difficult.
Across the board, the finalists performed very well on some queries (many queries had perfect scores of 1.0 AP) and struggled with others, resulting in a bimodal distribution of performance that looked like this:
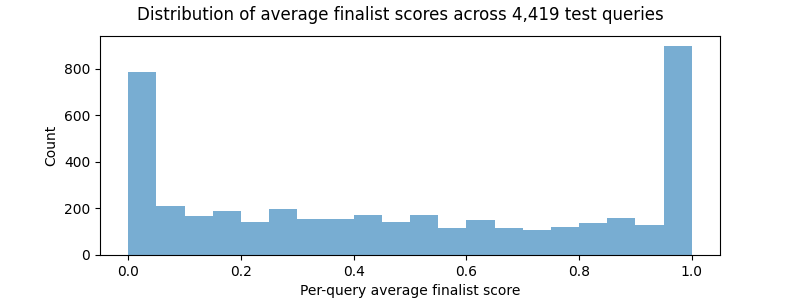
To make this more concrete, let's see what some example predictions looked like, sampling from both the relatively easy and difficult cases.
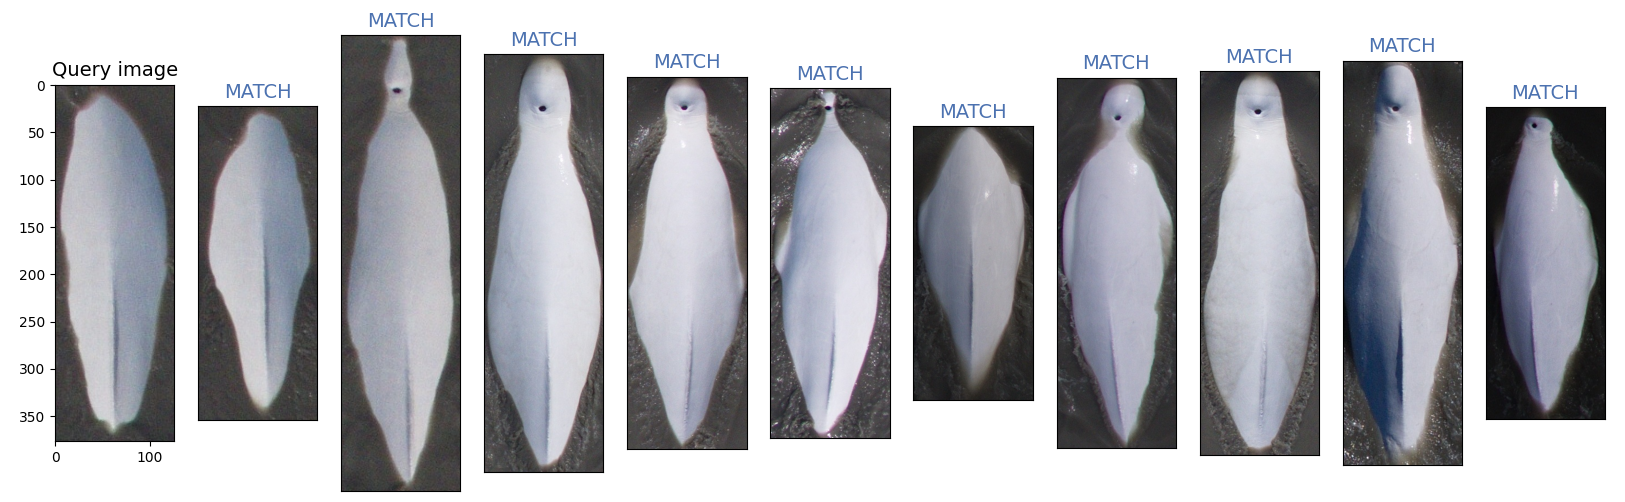
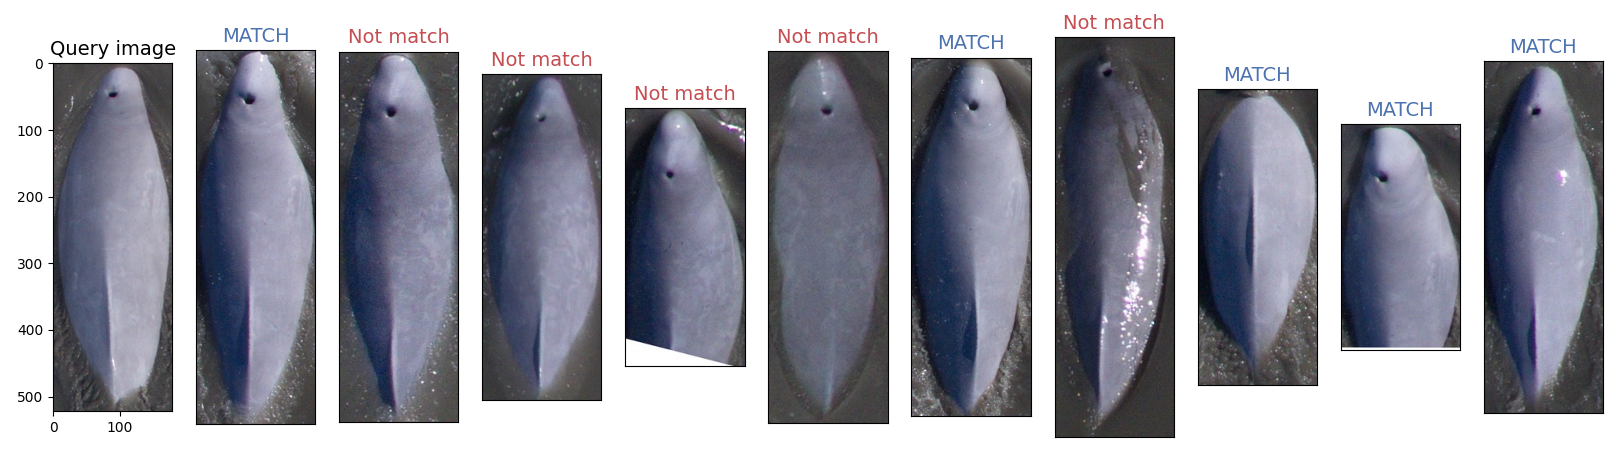
Remember that for each query image, participants returned a ranked list of the 20 database images that their model determined to be the closest matches to the query individual. Here is one case where there were 3 actual matches in the database for this whale and the finalist returned all 3 as their highest ranked images. We're showing just the first 10 predicted images here for visualization purposes.
Finalists were able to attain this level of perfection for 25% of all queries, which for several scenarios means finding the correct individuals from a database of >1,000 images! Here's another case where there were 20 matching images in the database and the finalist was able to find all of them. Successful performance like this was not uncommon among the finalists' solutions.
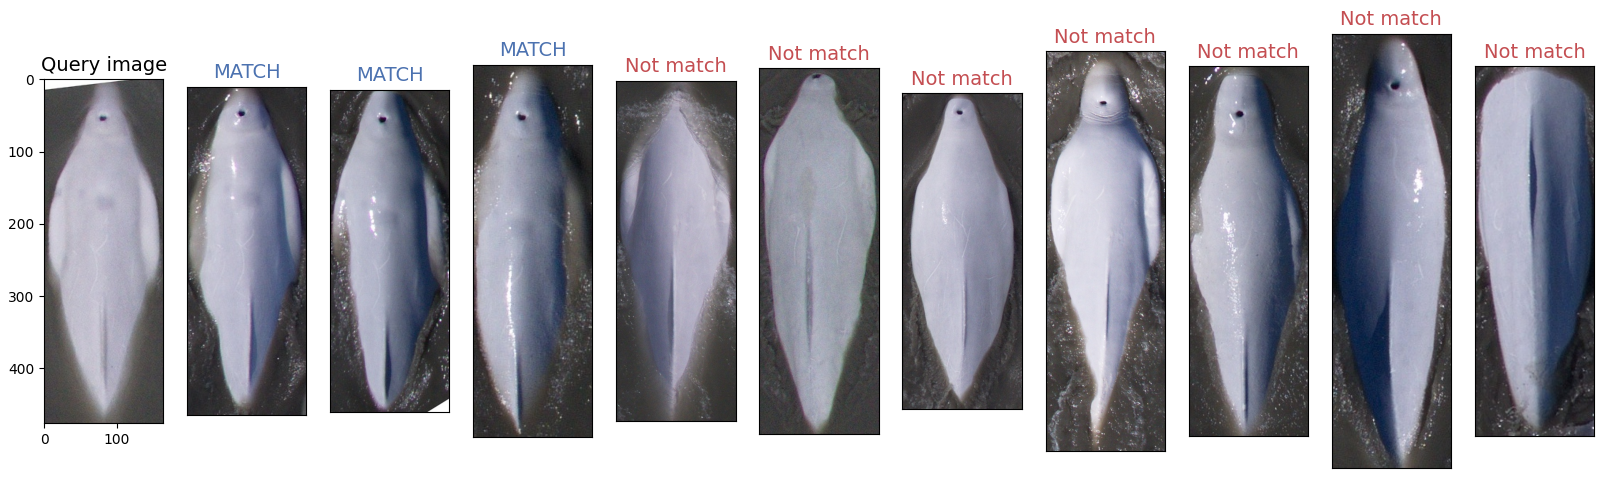
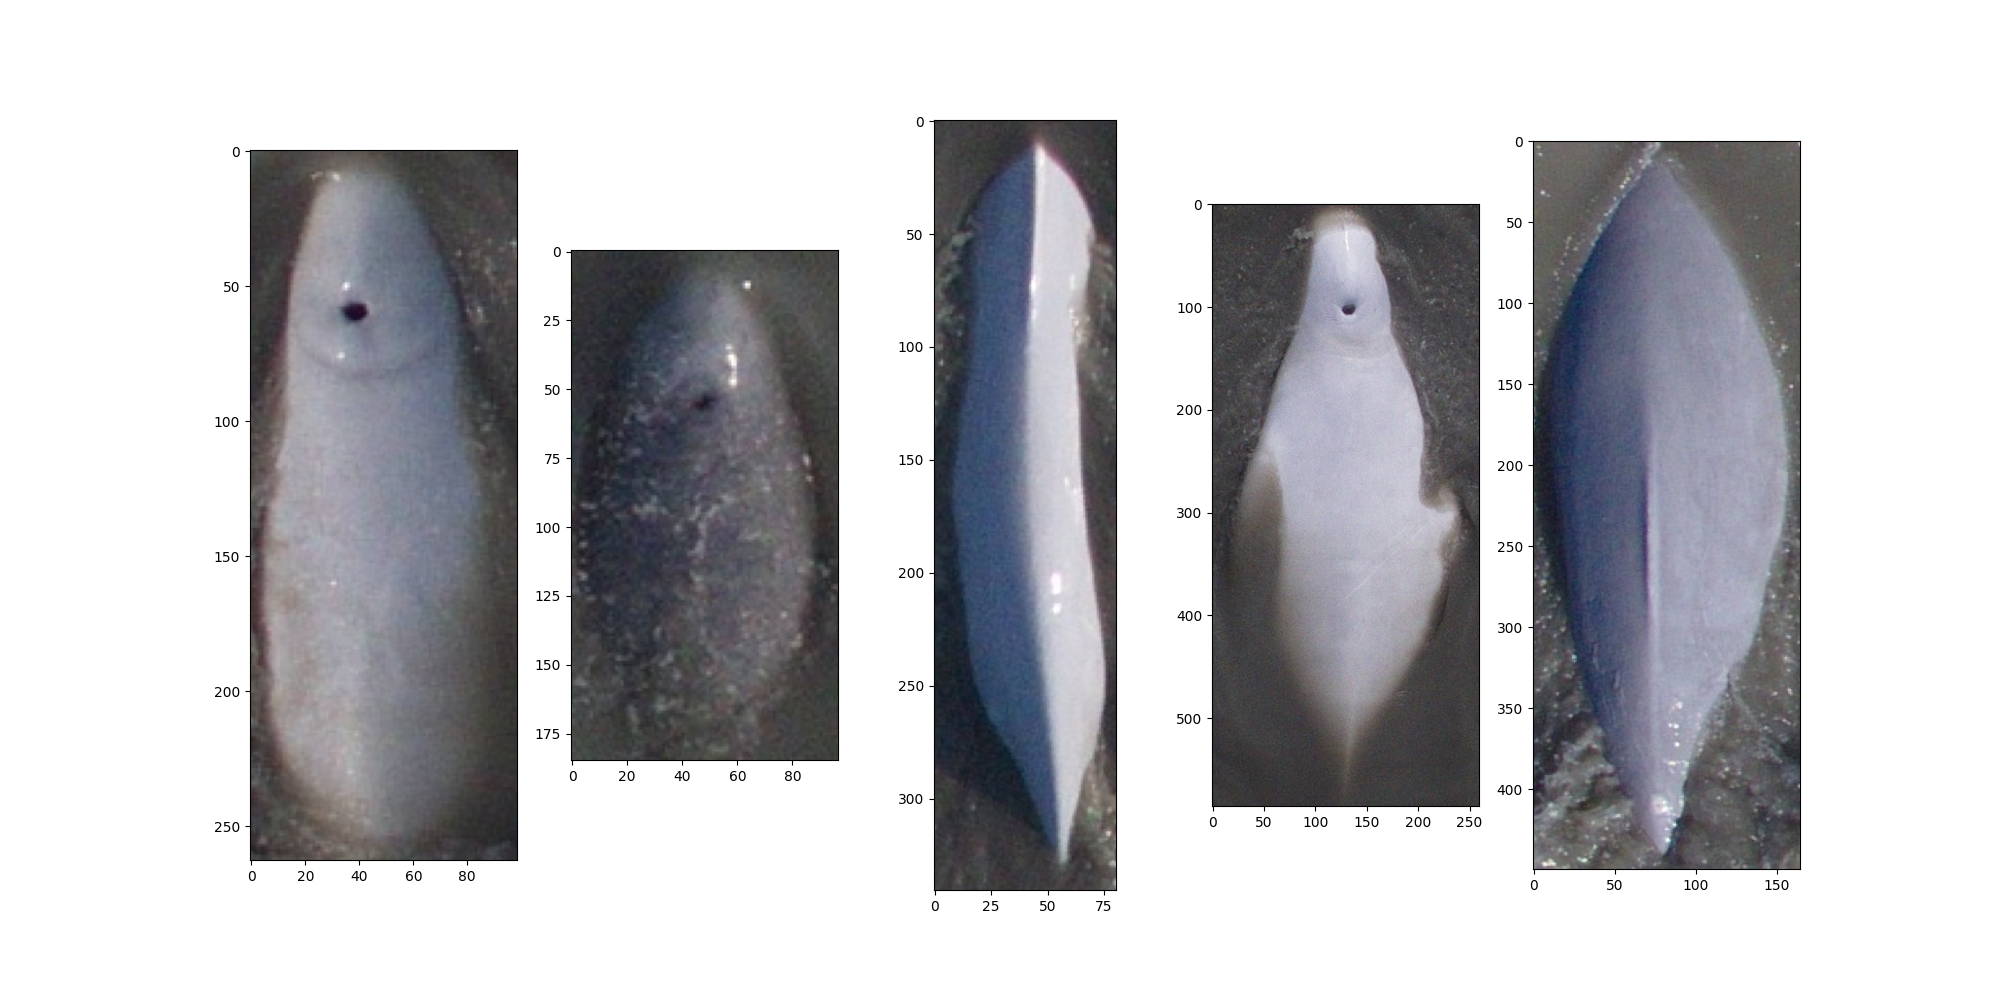
But some queries were more difficult. Here are some examples of query images where none of the finalists were able to find the matching images. In many of these more difficult cases, a relatively small section of the whale is above water, there may be splashing obscuring other body features, and/or image resolution is low. In some cases these difficult queries may even be evidence that the human labels could be incorrect or low confidence.
Lastly, now that we've looked at the easy and difficult cases, let's see what something in the middle looks like. The below query was the median difficulty query, as measured by the finalists' average AP for that query, which was 0.4596 in this case. There were a total of just 6 matching images for this beluga in the database of 3,290 images, and the 1st place finalist found 5 of the 6 images, all of which were in his top 10 ranked images (again, we're not showing all 20 ranked images for visualization purposes).
Explainability Bonus Round
Accurate and highly efficient models like these can significantly improve the workflows for wildlife researchers at our partner organizations, vastly decreasing the amount of manual labor required for animal re-identification and potentially even improving the accuracy of the current system. But there are no immediate plans to take the humans out of the loop. These models will most likely be used to surface likely matches to a human reviewer, who will then have the final say on what is actually a match.
To that end, we offered an additional Bonus Round for this challenge in which the top 4 finalists were invited to also generate explanatory visualizations, highlighting the visual features their models used to identify individuals. This enables us to both better understand how the models work, while also highlighting each model's areas of focus to help human reviewers in making their own assessments. Building this additional layer of complexity into their submissions was an undertaking in itself, and we're grateful to have received submissions from two of the finalists.
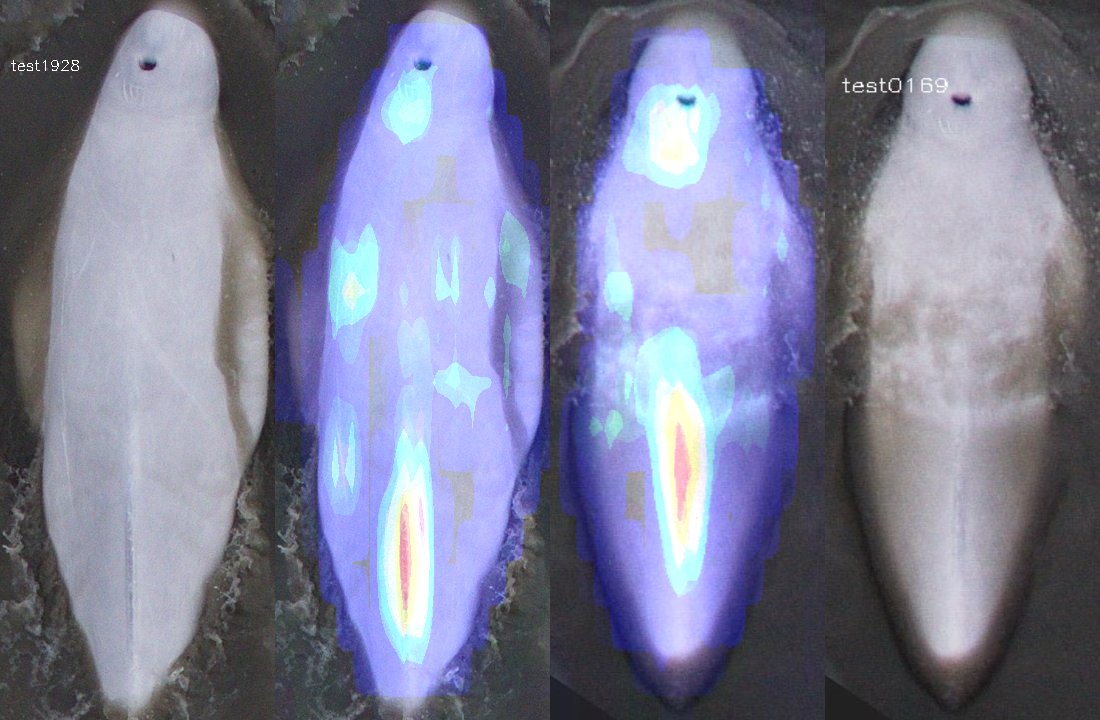
Both bonus round participants used Gradient-weighted Class Activation Maps to generate heatmaps highlighting the features of importance in any given image. We want to especially thank Ammar Ali (1st place) for his very thorough writeup and final visualization which combined heatmaps from his ensemble of 12 models.
Here is an example of this visualization technique for the first "easy" case we looked at above. In their Bonus Round writeups, our finalists observed that the dorsal ridge and surrounding area was the primary area of feature importance, and that scars such as those seen around the blowhole of this whale, were also very important, as can be seen from the heatmap below.
Common Themes in Winning Solutions
We're about to meet the winners, but before we do that, let's get to know them by their work.
One striking aspect of this challenge has been the consistency of certain techniques across the winning solutions. The top 4 finalists were separated by <0.01 mAP, and looking more closely at their solutions it is perhaps not surprising.
- All finalists used pre-trained EfficientNet backbones.
- All finalists trained on the belugas dataset using loss functions with proven success in facial recognition tasks, in most cases some variation on ArcFace.
- All finalists used an ensemble of around a dozen models, trained with k-fold cross validation and stratified by whale ID.
- Image flipping appears to have been a useful test time augmentation to apply for multiple finalists.
The variance between local validation scores and leaderboard scores seemed to be a problem for many participants, and finalists also reported a gap between local scores, which tended to be between 0.6-0.8 mAP, versus leaderboard scores which ultimately reached between 0.4-0.5 mAP. However, it appears that k-fold cross validation strategies, stratified by whale ID (such that the test set includes entirely new whales), may have helped to mitigate overfitting for the finalists.
For all the details on the winning solutions, including the bonus round submissions, check out the winner's repo. A version of the dataset used in this challenge also continues to be available at LILA BC for ongoing research.
Meet the winners
- 1st Place
- Ammar Ali and Mustafa Khalil
- 2nd Place
- Mehmet Çimen
- 3rd Place
- Yang Xu
- 4th Place
- Raphael Kiminya
Ammar Ali and Mustafa Khalil

|
|
Place: 1st Place
Prize: $17,000
Hometown: Jableh, Syria and Lisbon, Portugal
Username: Ammarali32
Background
-
I am a second year PhD student in applied computer science at ITMO University. I have worked on different projects including (Driver monitoring system , Driver assistant system, Text extraction automation) and on ML in specific (Object detection 2D/3D, Image segmentation 2D/3D, image retrieval, classification, OCRs, NERs, Image Captioning, Depth estimation, 3D Construction .. etc).
-
I am a software engineer working at CERN, Switzerland, focusing on Vacuum technologies.
What motivated you to compete in this challenge?
Well, at first this competition was interesting and fun. Moreover, Ammar started working on image retrieval recently, and since the competition will push to look through the latest SOTA, researches, new techniques and more. we decided to participate to push our knowledge and have fun.
Summary of approach
Training experiments and details
At the very beginning, I picked up my baseline from this competition [1], which I participated in 3 months ago for a job interview. I adjusted it for this competition data, started training and sent my first submission. This baseline is quite easy, it uses a simple efficient-b0 with Arcface loss. After making my first submission and making sure that all is good, I started my enhancement plan, modifying the architecture a little, trying different feature extractors, losses and augmentations. I also noticed that on the metadata, we will have information about whether the query image is a top or literal. Due to the unbalance be tween literal and top images, I decided to train model for top view images only and other models for literal view images. After reading top solutions from [2], I started enhancing by adding GeM pooling, Batch Normalization, Elastic Arc Face. I have tried to train (Convnext, swin, deit, resnet family, Efficientnet), and the best loss obtained was using EfficientNet B5 (B6, B7 wasn’t tried because I don’t have enough GPU power). I also tried different loss function including multi heads to train model that is able to separate between years (adding such models enhanced the results a little but was removed to keep the submission time limit).In addition, i tried to add MSE loss function between features of the same whale with the ArcFace loss (didn’t work), poly loss (best results of it was the same as cross entropy).
I was afraid of over-fitting especially that I am training on data with stratified folding (for each whale, I have images in both training and validation), but on the testing data there are completely new whales,and that make a gap between my validation score and the LB (when my validation was above 90, the LB was about 45. Therefore I decided to split the data using group folding to validate over totally new whales. to adjust the hyper-parameters then retrain over the original split (stratified split). That helped me to try tricks and post-processing locally and to be more confidant about my score. My Best single model CV was about 65 @top20 with tricks and about 85 @top1 over completely new whales. PS: All previous details are one only for models trained on top view images. For queries with different years or same year, I have trained some models and used them on the submission but lately I noticed that removing them enhanced my score on testing and LB so they were removed.
For literal view Images, I decided to convert them to a top problem based on the fact that if we have a solid model for top1 mAP for literal top cases, then we can use this model to get the best match for a literal query image then use the database first top image as a query image to find the top20. On the other hand, for top-literal queries, I was using the top models to find the first 2 similar query images then use the three query images (the main and the two founded) to get the matching literal images from the database. At the very end, I noticed that this is not eligible, so I removed it from my very last submission. Instead, I used literal models to find the best match literal from the database for the top query image then use this literal database image to get the top2 matching, and finally used the three images (query image and 2 database images) to find the rest (20). At first, I was training literal models by taking only one literal image and one top image for each whale to keep the data balanced and training was done over all data (no validation). But lately I changed that to another approach so for each top image in the training data, I took a random literal image then I trained the model so that for each batch and each label there are two images one top and another literal and loss is computed as arcface sum of both the literal features and top features, and that gave me a nice boost on the LB.
Tricks
- Test Time Augmentation (TTA), horizontal flip worked for me any thing else didn’t work for LB but worked for CV, So I just kept the horizontal flip.
- Use database images for re-ranking. For each query image, I found the best match top2 then computed the similarities for each image (query image, database images) with other database image.
- The similarities then added using weighted average with the following weights (0.4, 0.4, 0.2) Which are chosen according to the validation results of one fold.
- The similarities are raised to the power 7 before adding (using weighted average) This will definitely help if it is not necessary that the database has 20 or more images. and it gives a nice boost to my local testing but I don’t know if it did enhance the LB or made it worse even though I kept it.
Summary
Models trained: 1. EfficientNet-b5 with noisy student initial weights (5 Folds) over top view image only (stratifiedkfold over labels). 2. EfficientNet-rw-M (3 Folds 0 - 2 - 4) over top view image only (stratified kfold over labels). 3. EfficientNet-b5 with noisy student initial weights (4 Folds 0 - 1 - 2 - 4) over top and literal view images (stratifiedkfold over labels). Only whales that have a corresponding literal and top images on the database.
Loss Functions:
- Elastic ArcFace (All models)
- Cross Entropy (All models)
Training augmentations:
- Resize (512x512)
- HorizontalFlip (p = 0.5)
- One of (Sharpen, ToGray, CLAHE p = 0.3) for illumination stability p = 0.5
- ShiftScaleRotate (p = 0.5)
- ColorJitter (p = 0.5) for illumination stability
- Triangle (truncate white triangle on corners) used only while training EfficientNet-rw-M models
Solution Diagram
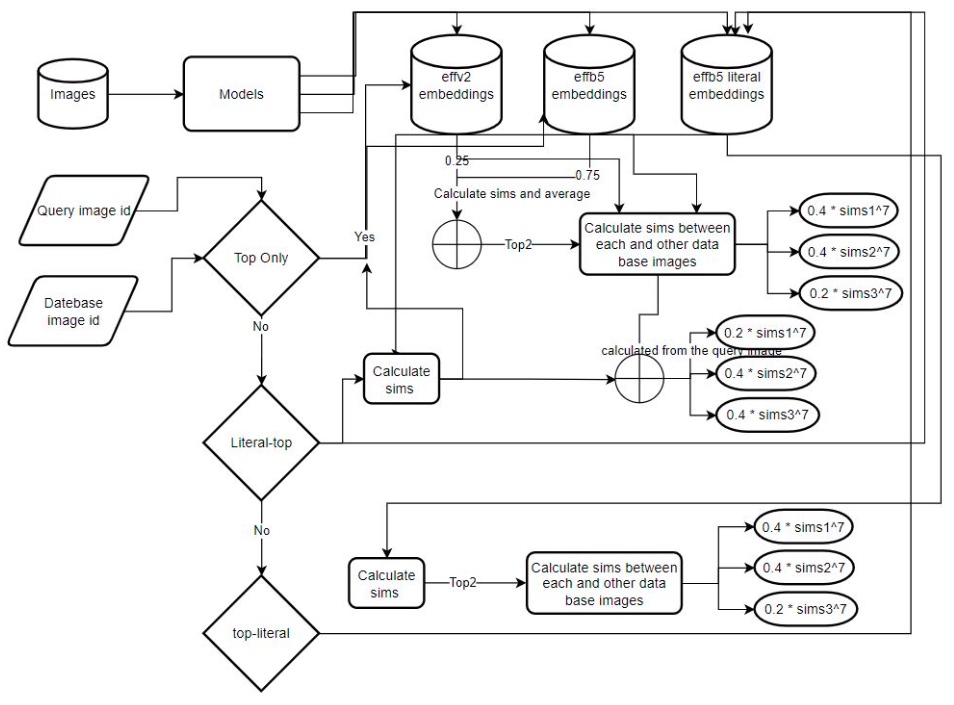
Figure 1: Inference (Solution Architecture)
[1] https://www.kaggle.com/competitions/where-is-the-toilet-the-right-one
[2] https://www.kaggle.com/competitions/happy-whale-and-dolphin/discussion/320310
Mehmet Çimen
Place: 2nd Place
Prize: $8,000
Hometown: Istanbul, Turkey
Username: qwerty64
Background
I graduated from computer science this semester. I am interested in computer vision and NLP.
What motivated you to compete in this challenge?
Helping the marine life is a very important effort. Also watching cute beluga videos further boosted my motivation.
Summary of approach
Solution is based on sub-center ArcFace with Dynamic margins. As a final submission I used ensemble of 7 models which all use EfficientNet backbones. I trained models with different configurations to create diverse ensemble of models. At test time concatenated all 7 model embeddings and flipped embeddings before calculating cosine similarity.
Yang Xu

Place: 3rd Place
Prize: $5,000
Hometown: China
Username: sheep
Background
I am a bioinformatic engineer with a master’s degree of Biochemistry. I also interested in take part in various data science competition. Have a competition grandmaster tie at Kaggle and also have some wins at Chinese domestic competitions.
What motivated you to compete in this challenge?
I miss the competition hold in Kaggle last few months. This one is similar, thus I decided to join in.
Summary of approach
Metric learning, for it is the most popular and maybe the most useful one for such problem.
This is a typical database retrieval problem. Since the dataset is small and very unbalanced, I focus on improving the representation of the whale. The major parts of the network includes CNN and transformer backbone, a Arcface head and a focal loss. Swin transformer performs better on local validation and is similar to Efficientnet on the leaderboard. Arcface head is commonly used on ReID and also performs well at this dataset.
I also tried some state of the art method like DOLG and adaptive Arcface, but the gap between the test set and the train set makes these methods merely the overfitting of cross validation. I also tried tricks like database augmentation and query extension, due to the size of the train set, these methods help merely a little.
Raphael Kiminya
Place: 4th Place
Prize: $5,000
Hometown: Meru, Kenya
Username: karelds
Background
I’m an independent data scientist.
What motivated you to compete in this challenge?
I recently participated in a similar competition where the task was to build a face recognition model for turtles. I hoped to apply the lessons learned here.
Summary of approach
I started out with a simple classification approach - ImageNet pretrained EfficientNet noisy student model, with label smoothing loss, fastai for the training with default augmentations and one cycle lr scheduler. The training set was noisy - there were 788 unique whale IDs in the dataset, in contrast to the expected population of roughly 300 Cook Inlet belugas. After trying a few things to reduce the effect of this inconsistency, what worked best was simply dropping whale IDS with less than 4 samples. I ended up with a smaller dataset (383 classes), which surprisingly produced better results (CV and LB) than the complete dataset.
I came across the Deep Orthogonal Local and Global (DOLG) framework, which has been successful in recent image retrieval competitions. I used models and weights from the classification step as backbone for the DOLG framework, switched the loss function to ArcFace with adaptive margins and trained with discriminative learning rates.
My final solution was an ensemble of 15 models (3 x 5 fold cv), trained with different image sizes and on different subsets of the dataset. During inference, I applied horizontal flip augmentation, which slightly boosted the score.
Thanks to all the participants and to our winners! Special thanks to our partners at the Bureau of Ocean Energy Management (BOEM), NOAA Fisheries and Wild Me for enabling this important and interesting challenge and for providing the data to make it possible!


