We are starting an initiative at DrivenData to feature some of the fantastic members in our data science community. The goal of the Community Spotlight is to bring greater visibility to the diversity of expertise, perspectives, and experiences of our community members.
In this post we sit down with Quy Nguyen, a winner of the safe aging challenge and data scientist working in Singapore.
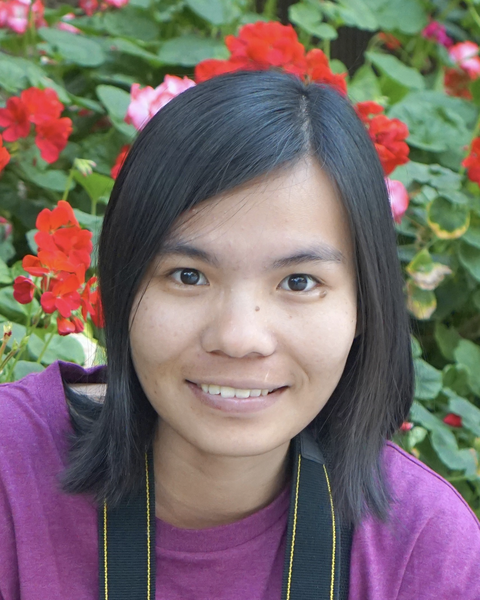
Name: Quy Nguyen
Hometown: Binh Dinh Province, Vietnam
To get started, tell us a little about yourself.
Growing up in a rural area in Vietnam, it has been quite a journey for me to become a senior data scientist. Currently, I work in Singapore. I enjoy making sense of data from data exploration, modeling, running experiments, and creating impact in social and business settings.
When I am not working, I like traveling, reading, cooking and spending time with my family and friends.
How did you get started in data science?
My major was in information systems which taught me how to collect, organize, process, and present data, so it was natural for me to get into data science. In college, I took fundamental courses in programming, artificial intelligence, data mining, and databases. Most of my modules were project-based, where we were expected to build things that are interesting. A few challenging projects I still remember are detecting contours in images, password authentication using keystroke biometrics, protein structure prediction, and location-based restaurant recommendation.
My journey into the real world started when I got an internship where my mentor was a PhD in computer science from Georgia Tech. I was introduced to data science competitions and got hooked from that point forward. I spent most of my free time learning data science on Coursera and doing data science competitions. Along the way, I met and learned from many other talented data scientists around the world. I am thankful for encouraging professors, teachers, mentors, talented classmates and colleagues who guided and helped me grow my interest in data science.
What motivated you to join a DrivenData competition?
As an applied data scientist, I always want to work on different kinds of problems to gain domain knowledge and to keep my skills sharp. I found DrivenData as a diverse and interesting set of real-world challenges.
Storytelling or effective communication is a very important skill for any data scientist. Its role is equally important as other technical skills. It is extremely useful for data scientists when defining problems to be able to effectively communicate the projects’ outcomes to business stakeholders.
Is there a particular DrivenData challenge you’ve enjoyed working on?
I was very excited about solving the Safe Aging challenge in which I was one of the winners. This competition was quite challenging and exciting due to the many potential applications of human activity recognition in healthcare, fitness, and public safety. By predicting activities of daily living and posture or ambulation from the participants, I had the opportunity to help the elderly to live safely at home, and this was the main motivation for me to take part. I was happy to be part of the journey of preparing for the future of aging population and realizing the very meaningful vision of the project. Besides, the challenge provided various kinds of data, from wearable sensory data to RGB-D camera, and passive environmental sensor data.
I worked with a teammate on this problem set - he designed the main flow of the modeling, stacking and validation processes, while I worked on feature engineering. As the data points were all in a time series, the lag features of previous data points of the time series were very strong predictors. Before generating lag features, I reduced the noise from the signal. I extracted a few sets of features such as statistical features, physical interpretations of human motion. Building an extra model to generate more features is also helpful, for example detecting location. Intuitively, this variable should be very useful to predict the activity of the person: for instance, when someone is in a bathroom, it should be very unlikely for him to be jumping or lying down!
The details of our approach can be found at here. After the competition, we collaborated with the 1st place winner and published a paper. Our work was accepted at Advanced Data Mining and Application Conference (ADMA).
What hurdles have you had to overcome to become a data scientist? What advice would you give to others facing the same challenges?
I would say storytelling or effective communication is a very important skill for any data scientist. Its role is equally important as other technical skills. It is extremely useful for data scientists when defining problems or business objectives to be able to effectively communicate the projects’ outcomes to business stakeholders.
In the beginning, most of my projects stopped at the POC stage. Initially, it was hard for me to convince my product managers to put my model in production because they were not able to recognize its viability. Thanks to my managers and mentors, I gradually got better at this. For other data scientists facing the same challenge, I would say "practice makes perfect". For instance, mentoring interns and teaching are excellent opportunities to practice explaining complex technical terms and concepts. Reading books, blog posts, and related business topics is also a great way to learn about business or gain a sense of how a product or process works.
Have you read any good books or articles recently?
I recently watched The Social Dilemma, a documentary that illustrates the societal impacts of machine learning on human and artificial intelligence (AI) safety. There are many advanced AI systems that can nudge people to spend more time on services so that companies can grow their revenue. It would be nice to work on AI systems that nudge individuals to improve health, wealth and happiness while keeping data ethics and rights in mind.
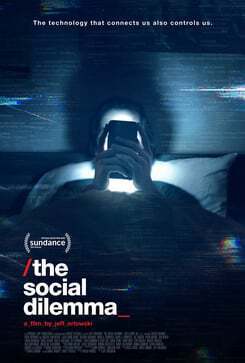
Photo: The Social Dilemma promotional poster/Netflix.
Where can the community find you online?
I can be found on LinkedIn at http://sg.linkedin.com/in/quyntk/.
Thanks to Quy (@kimquy06) for sharing her thoughts on work, life, and data science! We are excited to feature more great community members. If you think you or someone you know would be a great addition to a future Community Spotlight, let us know!


