
Genetic engineering is a powerful tool with a wide array of applications. It's being used to do everything from creating safe alternatives to pesticides to producing critical ingredients for medicines and industry. However, it's rise and increasing accessibility also comes with the potential for lab accidents, purposeful wrongdoing, and abuse.
Genetic engineering attribution is a tool that can help promote accountability and deter bad actors. In our newest competition, we're asking you to to create an algorithm that identifies the lab-of-origin for genetically engineered DNA—with the highest accuracy level possible. The metric for this competition is top ten accuracy.
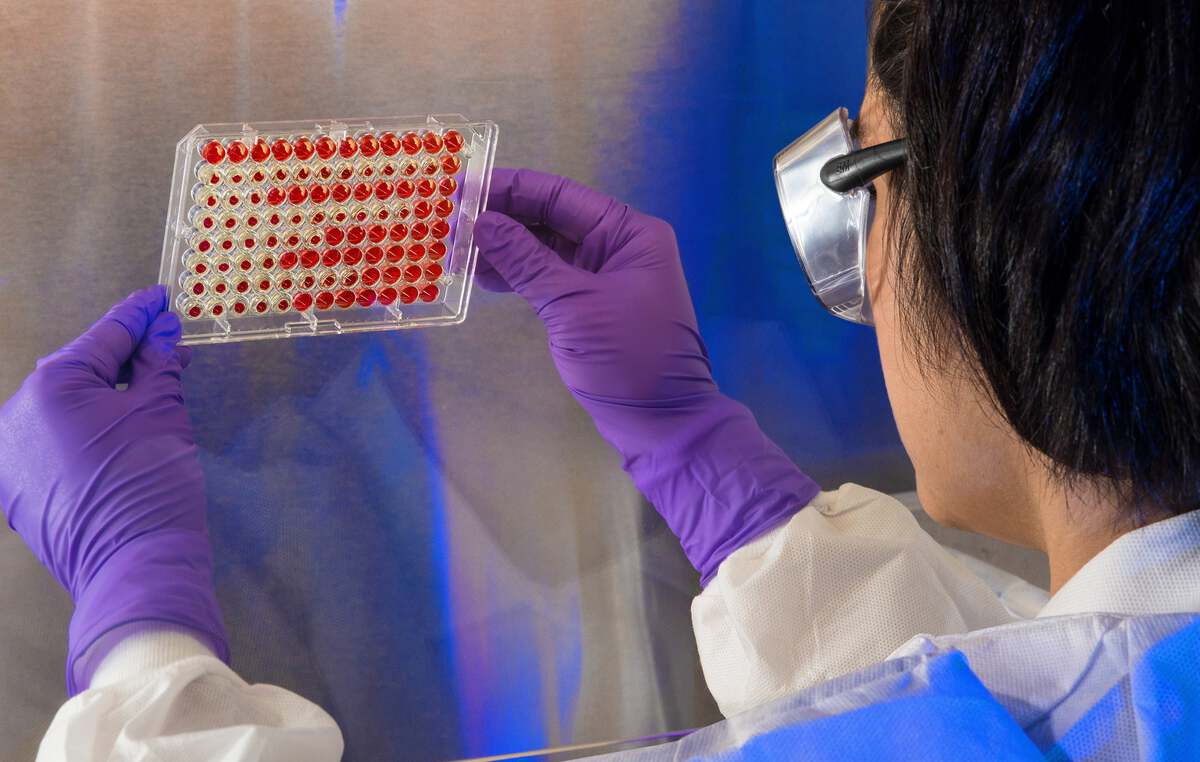
The DNA for this challenge comes from an online dataset of plasmids. Plasmids are small, circular DNA molecules that replicate independently from chromosomes. Plasmids used commonly in research come from cells in mammals, bacteria, worms, yeast, and insects. Plasmid information can be uploaded and accessed digitally thanks to AddGene, a large, non-profit plasmid repository based in Watertown, MA.
In this benchmark, we'll cover how to:
- load the data
- create text-based features from DNA sequences
- train a random forest model and make predictions
- create a custom scorer based on top-ten accuracy
- submit predictions to the competition
To get started, we import the standard tools of the trade.
from pathlib import Path

import pandas as pd
import matplotlib.pyplot as plt
import numpy as np
import seaborn as sns


%matplotlib inline
sns.set()
Loading the Data
On the data download page, we provide everything you need to get started:
- Training Features: These are the features you'll use to train a model. There are 39 features, including the plasmid DNA sequence and metadata about the plasmids. Each row has an identifier called
sequence_id, a unique 5-character alphanumeric string. - Training Labels: These are the labels. Every
sequence_idin the training values data has a corresponding label in this file, given by alab_id. Alab_idis a unique, 8-character alphanumeric identifier for a particular lab. The labels are one-hot encoded. - Test Features: These are the features you'll use to make predictions after training a model. We don't give you the labels for these samples; it's up to you to predict labs for these
sequence_ids. - Submission Format: This is what a submission should look like, including the file, column, and row names. Since evaluation is based on top ten accuracy, you'll need to submit class probabilities instead of a single class prediction. The submission format has random floats between 0 and 1 filled in as a baseline. Your submission to the leaderboard must be in this exact form (with different probability values, of course) in order to be scored successfully!
Since this is a benchmark, we're only going to use a subset of the features in the dataset. It's up to you to take advantage of all the information!
DATA_DIR = Path.cwd().parent / "data" / "final" / "public"
train_values = pd.read_csv(DATA_DIR / "train_values.csv", index_col="sequence_id")
train_labels = pd.read_csv(DATA_DIR / "train_labels.csv", index_col="sequence_id")
test_values = pd.read_csv(DATA_DIR / "test_values.csv", index_col="sequence_id")
Explore the Data
Let's take a quick look at all of the data we have available. First let's check out our features.
Training set
train_values.head()
We have one non-numeric column, sequence, which contains the DNA plasmid sequence.
train_values.dtypes
The length of these sequences vary. Some are as short as 20 characters and others are as long as 60,000!
sequence_lengths = train_values.sequence.apply(len)

sequence_lengths.describe()
sequence_lengths.plot(
    kind="hist", title="Distribution of DNA Sequence Lengths", bins=100, xlim=(0, 20000)
);  # don't plot super long sequences

The rest of our features are binary, one hot encoded columns.
# exclude the 0th column which is the dna sequence
train_values.iloc[:, 1:].apply(pd.value_counts)
Since these columns are binary, the mean value shows us the prevalence, meaning what proportion of sequences have that characteristic. Check out the problem description page for definitions of each feature.
This plot shows us that a few features are common across sequences but most are quite rare.
sorted_binary_features = train_values.iloc[:, 1:].mean().sort_values()

ax = sorted_binary_features.plot(
    kind="barh", stacked=True, figsize=(5, 12), title="Prevalence of Binary Features"
)
ax.set_xlabel("Proportion of sequences");

Test set
Our test set features are set up in the same way as the training set.
test_values.head()
test_values.sequence.apply(len).describe()
Training Labels
Now let's look at our labels. It's important to recognize that these are one-hot encoded. Each column represents a lab ID. The correct lab for a given sequence_id is indicated by a 1.0 in that column, and 0.0 otherwise.
train_labels.head()
To make our modeling and analysis simpler, let's collapse the labels dataframe into one column that shows us the lab ID for each sequence.
# get the column with the max value in each row
lab_ids = pd.DataFrame(train_labels.idxmax(axis=1), columns=["lab_id"])
lab_ids.head()
Labs can have anywhere from 1 to over 8,000 sequences in the data. On average, there are about 48 sequences per lab in the training data.
# get the distrubtion of lab prevalence in the training set
lab_ids["lab_id"].value_counts().describe()
Sorting labs by prevalence, we see that lab ID I7FXTVDP accounts for 13% of the sequences in the train set. The top 3 labs account for more than 20% of the data. We'll have to be mindful of class imbalance in our training.
# Sort lab ids by prevalence
(lab_ids["lab_id"].value_counts(normalize=True).sort_values(ascending=False)).head()
Construct Features from DNA Sequences
For this benchmark, we're going to use the DNA sequences as the basis for the features in our model. We've got some preprocessing work to do to turn these lengthy strings into useful features!
These sequences are composed of five characters. G, C, A, and T represent the four nucleotides commonly found in DNA (guanine, cytosine, adenine, thymine). N stand for any nucleotide (not a gap).
bases = set("".join(train_values.sequence.values))
bases
One common way to turn strings into useful features is to count n-grams, or continuous subsequences of length n. Here, we'll split up the DNA sequences into four-grams, or subsequences consisting of 4 bases.
With 5 unique bases, we can produce 120 different sequence permutations consisting of 4 bases. You can play around with the length of n to see how it affects your model.
from itertools import permutations

n = 4
subsequences = ["".join(permutation) for permutation in permutations(bases, r=n)]
print(f"Number of subsequences: {len(subsequences)}")
subsequences[:10]
We can now turn our strings into features by taking a simple count of each subsequence. We could do this one of two ways:
Overlapping substrings: To count overlapping substrings, we would use a sliding window such that the sequence "ATTATTA" will result in a count of 2 for the substring "ATTA" ("ATTA-TTA" and "ATT-ATTA").
Non-overlapping substrings: To count non-overlapping substrings, we search for each substring. If we find it, we count it and then continue our search at the end of the substring. In this case, "ATTATTA" will result in a count of 1 for the substring "ATTA" ("ATTA-TTA").
For simplicity, we're going to use the second method of non-overlapping substrings. We can use the built in count method on strings. Feel free to try both methods to see how it affects your model.
# Example of built-in count method on strings
# Because it's non-overlapping, "atta" is only counted twice
"gattattattaca".count("atta")
Now let's create a helper function to generate features. get_ngram_features will create a new dataframe that holds the counts for each subsequence and row in our data.
def get_ngram_features(data, subsequences):
    """Generates counts for each subsequence.

    Args:
        data (DataFrame): The data you want to create features from. Must include a "sequence" column.
        subsequences (list): A list of subsequences to count.

    Returns:
        DataFrame: A DataFrame with one column for each subsequence.
    """
    features = pd.DataFrame(index=data.index)
    for subseq in subsequences:
        features[subseq] = data.sequence.str.count(subseq)
    return features
Using our helper function, we can generate feautures for all the sequences in our training set! This will take a minute or two to run.
# Calculate n-gram features on our training set
ngram_features = get_ngram_features(train_values, subsequences)
ngram_features.head()
ngram_features.shape
We now have features for all 120 possible subsequences. Their values show the counts of each 4-gram within the full DNA sequence.
Let's join them with our one-hot endcoded binary features.
all_features = ngram_features.join(train_values.drop("sequence", axis=1))
all_features.head()
all_features.shape
The Error Metric: Top Ten Accuracy
The goal for this competition is to help narrow down the field of possible labs-of-origin from thousands to just a few. To that end, predictions will be evaluated based on top-ten accuracy. That means we'll consider a prediction "correct" if the true lab-of-origin is in the top ten most likely labs.
There is not a built in evaluation metric for top-k accuracy in scikit-learn, so we'll be constructing a custom scorer. We'll use this to determine the final accuracy of our model.
First, we'll need to create a custom scorer that can take in an estimator, validation data, and labels, and output a score based on the top ten results from each predicton. Scikit-learn let's us do this if we adhere to a specific signature.
From the documentation:
For a callable to be a scorer, it needs to meet the protocol specified by the following two rules:
It can be called with parameters (estimator, X, y), where estimator is the model that should be evaluated, X is validation data, and y is the ground truth target for X (in the supervised case) or None (in the unsupervised case).
It returns a floating point number that quantifies the estimator prediction quality on X, with reference to y. Again, by convention higher numbers are better, so if your scorer returns loss, that value should be negated.
def top10_accuracy_scorer(estimator, X, y):
    """A custom scorer that evaluates a model on whether the correct label is in
    the top 10 most probable predictions.

    Args:
        estimator (sklearn estimator): The sklearn model that should be evaluated.
        X (numpy array): The validation data.
        y (numpy array): The ground truth labels.

    Returns:
        float: Accuracy of the model as defined by the proportion of predictions
               in which the correct label was in the top 10. Higher is better.
    """
    # predict the probabilities across all possible labels for rows in our training set
    probas = estimator.predict_proba(X)

    # get the indices for top 10 predictions for each row; these are the last ten in each row
    # Note: We use argpartition, which is O(n), vs argsort, which uses the quicksort algorithm
    # by default and is O(n^2) in the worst case. We can do this because we only need the top ten
    # partitioned, not in sorted order.
    # Documentation: https://numpy.org/doc/1.18/reference/generated/numpy.argpartition.html
    top10_idx = np.argpartition(probas, -10, axis=1)[:, -10:]

    # index into the classes list using the top ten indices to get the class names
    top10_preds = estimator.classes_[top10_idx]

    # check if y-true is in top 10 for each set of predictions
    mask = top10_preds == y.reshape((y.size, 1))

    # take the mean
    top_10_accuracy = mask.any(axis=1).mean()

    return top_10_accuracy
Build the Model
Random forests are often a good first model to try so we'll start there. We'll leave more complicated modeling and feature selection up to you!
Random Forest
It's easy to build a random forest model with Scikit Learn. We're going to create a simple model with a few specified hyperparameters.
Tip: If you wanted to get fancy, you could perform a cross-validated grid search with GridSearchCV. You could even use the custom scorer we made earlier to train your model by passing it in via the scoring parameter.
from sklearn.ensemble import RandomForestClassifier
Let's generate our labels and rename our features to match.
# Rename our feature array
X = all_features

# Create our labels
y = lab_ids.values.ravel()
We've got our features and our labels. Time to train!
Wait a sec... aren't we forgetting something? Oh right, we still have to address the class imbalance we discovered earlier. Luckily, scikit-learn has an easy solution for us. We can set class_weight to "balanced". This will set class weights inversely proportional to the class frequency.
Great! Now let's generate and fit our model.
# instantiate our RF Classifier
rf = RandomForestClassifier(
    n_jobs=4,
    n_estimators=150,
    class_weight="balanced",  # balance classes
    max_depth=3,  # shallow tree depth to prevent overfitting
    random_state=0,  # set a seed for reproducibility
)

# fit our model
rf.fit(X, y)
Let's see how our model scored on our training data.
rf.score(X, y)
Nice! 19.30% accuracy isn't too shabby for our first try. However, that's using the default scorer, which is vanilla top-1 accuracy. We should expect to do better on the competition metric, top-10 accuracy. Let's use our custom defined scorer to see how we did:
top10_accuracy_scorer(rf, X, y)
Our model got about 37.85% top ten accuracy. Not bad! Now let's make some predictions using our newly trained model.
Time to Predict and Submit
Now we'll create features from our test set and generate predictions. We need to make sure to generate probabilities for each lab ID so that the top 10 accuracy metric can be computed.
First, let's create the 4-gram features and join it with the binary features.
test_ngram_features = get_ngram_features(test_values, subsequences)
all_test_features = test_ngram_features.join(test_values.drop("sequence", axis=1))
Make Predictions
It's important to use predict_proba here, which gives us class probabilities, instead of predict, which would give us class predictions.
probas = rf.predict_proba(all_test_features)

# Examine first row
probas[0]
Save Submission
Now let's get our matrix of probabilities ready for submission.
submission_format = pd.read_csv(
    DATA_DIR / "submission_format.csv", index_col="sequence_id"
)
submission_format.head()
Before we create our submission csv, let's make sure the submission format matches the shape of our predicted probabilities. We're also going to check that the predicted classes are in the same order as the submission format columns.
assert submission_format.shape == probas.shape
assert (rf.classes_ == submission_format.columns).all()
my_submission = pd.DataFrame(
    data=probas, columns=rf.classes_, index=submission_format.index
)
my_submission.head()
Looks good! Let's save and submit!
my_submission.to_csv("submission.csv")
Submit to Leaderboard
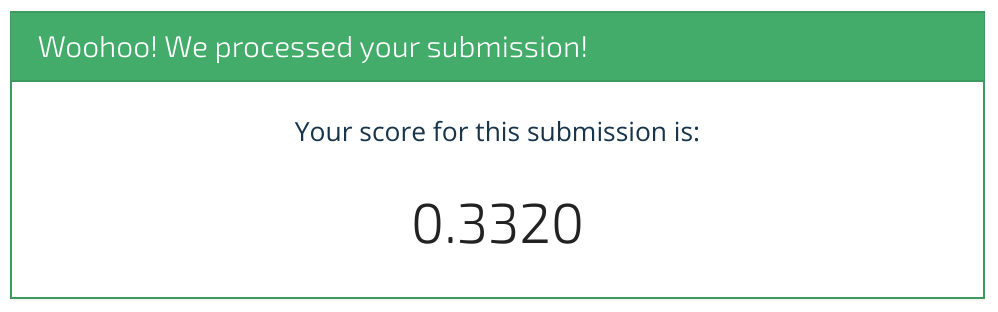
Woohoo, we scored 33.2%! We hope this benchmark has shown you how to get started. We can't wait to see what you come up with. Happy modeling!


