

Just in the US, more than 10 million adults are 65+ years of age and live alone. One of the biggest impediments to independent aging-in-place is the ability to detect and respond when something goes wrong. We now have the ability to use passive sensors (like motion detectors and accelerometers) to monitor some aspects of an older person's activity privately and unobtrusively. But we don't yet have reliable ways to turn this information into an actionable view of what is happening to them in real life.
That's where the Safe Aging with SPHERE competition, sponsored by AARP Foundation, comes in. In this challenge, the SPHERE Inter-disciplinary Research Collaboration assembled a unique dataset from its research home facility in Bristol, UK. What makes this dataset particularly interesting is that, in addition to recording the outputs from smart technologies like wearables and environmental sensors, the research center also has human-labeled descriptions of what seniors were doing - their activities, like meal preparation or watching TV; and their positions, like walking or sitting - while those technologies were in use.
Competitors were charged with building computer algorithms that could translate the easier-to-collect sensor data into harder-to-collect information about real activities. Before the competition, the benchmark model could make that translation with an accuracy of 0.2127, as measured by the Brier score–– a cost function for probabilistic forecasts. The Brier score ranges from 0 (perfect forecast) to 1 (worst possible forecast). The top competitors were able to achieve a 34%-38% improvement on the benchmark model with Brier scores ranging from 0.1397-0.1346. This means that roughly 9 out of 10 predictions matched the human-labeled descriptions provided by SPHERE.
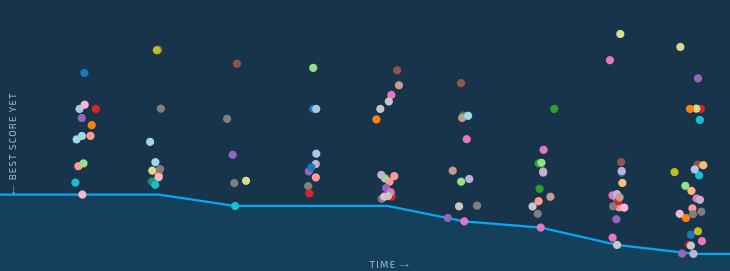
We saw more than 500 people sign up for this competition, and the top scores continued to push the boundary of what was possible all the way until the end. Congratulations to everyone who participated! You can learn more about the approaches that outperformed the rest, and the talented people behind them, in their generous explanations below.
Meet the winners!
Daniel Fernandez
Place: 1st
Home base: Devon, England
Daniel's background: I am Building Services Design Engineer, specialized in bioclimatic design and energy efficiency. I am from Spain but currently I am living in Devon, England. Two years ago I started learning about Machine Learning & Artificial Intelligence, and I have been involved in Data Science Competitions during the last year. Now I am looking for new job opportunities in these areas.
Method overview: Most of the time I was working in feature engineering. I made parallel research for each group of data (i.e. accelerometer, RSSI, PIR and video). Finally I generated a bunch of features as combination of different techniques:
-
Moving Average: time window between registers is very noisy. I got good results calculating the moving average for several registers. It was particularly good for video data (M10, average of past 10 registers, actual register, and future 10 registers), RSSI (M32) and PIR (M2s, past 2 seconds, actual second, future 2 seconds).
-
New features: For each type of data, I created some useful features. Best results were obtained for video data, extracting distances, areas, volume, and moving features.
-
Time window: Before aggregating registers, I used the standard 1 second time window, and also two windows of 0.5 seconds each. The last one resulted very useful.
-
Aggregation: Mainly the same as the example benchmark: mean, max, min, median and standard deviation.
Finally I added a new meta-feature (predicted location), past data (2 seconds) and future data (1 second).
In order to generate variation on the predictions and consequently good results after stacking, I selected 7 subsets of features by random/optimization and I trained a bunch of Layer 1 models with them (ExtraTrees, RandomForest, XGBoost, Neural Networks and Linear Regression).
In Layer 2, I selected again 4 subset of meta-features (L1 models) by random/optimization and I trained 7 L2 models. The final submission is a weighted average of theses predictions.


Team Dataiku
Place: 2nd
Home base: Paris, France
Dataiku's background: Maxime Voisin: Graduate Student in Management Science & Engineering at Stanford University
Method overview: There were 4 steps in our approach:
STEP 1: Change the structure of the train set to make it look like the test set
The raw train and test sets were inherently different. The train set was generated with 10 elderly individuals. The test set was also generated with 10 elderly individuals – but not the same individuals as those involved in the train set. And here's the crucial difference between train and test sets. In the train set, each of the 10 individuals has been recorded for 5 hours. So the train set consists of 10 continuous sequences of 5 hours of monitoring. But in the test set, each of the 10 individuals has been recorded 100 times, for 10 seconds every time. So the test set consists of 1000+ continuous sequences of 10 seconds of monitoring!
The first step was to change the structure of the train test, to make it look like the test set. We randomly split the train sequences of 5 hours into 1000+ small sequences of approximately 10 seconds. It is possible to generate several training sets this way – by using several random seeds for the random split - and follow a bagging approach: create one model per training set and average their prediction. This approach showed very good results in cross validation, but it was not part of the final model.
STEP 2: Feature engineering
Feature engineering aims at converting raw, hard-to-interpret variables into meaningful ones. This step is key in many machine learning problems since it can determine the quality of predictions.
First, we computed some basic features: speeds, accelerations, derivative of accelerations, rotations. They should intuitively help us predict the activity performed by the individual.
Second, we added lags on most variables. How? By adding columns that inform on the value of each variable 1 second ago, 2 seconds ago... up to 10 seconds ago. Here, we realized how crucial it was to make train and test sets look alike: if we had not done so, then the train set would consist of 5-hour continuous sequences – so only the first 10 lines would have missing lag values; whereas the test would consist of 10-second continuous sequences – almost all the lines would have many missing lag values. If we had not homogenized the structure of train and test sets, then the lag variables would have different distributions on train and test sets - we therefore avoided a covariate shift.
Since adding lags worked well, we decided to add reverse lags. Reverse lags – or leads – turned out to add a lot of information resulting in significant cross validation score improvements. I also suspect that some people had worn their accelerometers upside down. So, for these people, I multiplied the accelerometer's raw data by -1.
STEP 3: Enriching the data with stack transferring
A room variable indicates the room where the individual is located. Intuitively, this variable should be very useful to predict the activity of the person: for instance, when someone is in the toilets, it should be very improbable for him to be jumping or lying down! Unfortunately, this room variable is available in the train set, but it is missing in the test set. We came up with a clever technique – that we call stack transferring – to deal with this.
-
Step 1: On the test set, predict the room variable . You can add the room variable on the test set, by predicting it. You just need to build a model that predicts the room variable. Make it learn on the train set – where we have the exact values of the room- variable – and apply it on the test set – where the room-variable is missing. Now, you have the room variable on the test set.
-
Step 2: On the train set, update the room variable: replace its exact values by its out-of-fold predictions. Here's the stack transferring trick. On the train set, you should replace the exact values of the room variable by out-of-folds predictions of the room variable! In other words, use 90% of the train set to predict the room variable on the 10% remaining train set. By doing so 10 times, you can predict the room variable on all the train set. You have just generated out-of- folds predictions of the room variable on the train set! Now, you can update the room variable on the train set: drop the exact values of the room variable and keep its out-of-fold predictions.
-
Step 3: Use the out-of-folds predictions of the room variable to predict the activity variable. The updated room variable should help you predict the activity performed by an individual. Simply add this updated variable to your model. It should improve your results!
Note 1: In our case, the individuals of train and test sets were asked to perform the same list of actions in the same order. Therefore, the room variable had the same distribution on train and test sets. This is a necessary condition if you want stack transferring to perform well.
Note 2: In order to generate out-of-fold predictions on the train set, we split our train data into 10 folds. Each fold corresponds to the data generated by one user, in order to avoid any leakage.
STEP 4: Fine-tune individual models to enter top 5, stack to take the lead
It's in general a good idea to start with a simple model that does not need much tuning – like random forests – while you are doing feature engineering. They are easy to implement and able to handle large amounts of variables, so they give you valuable feedback on the quality of your work. Feature engineering diminished our random forest's error-rate from 22% to 16.4%, ranking us 15th of the competition.
When performance seems to reach a plateau even when you are adding new features, try other models that require more tuning. We then went on for the machine learning blockbuster – XGBoost. Once fine-tuned, it performed very well, decreasing our error rate to 14.6% and ranking us top 5!
Finally, we decided to give the stacking technique a try. This ensemble learning technique combines the predictions of diverse individual models and leverages their strengths. Stacking 10 individual models – including linear regressions, Naive Bayes classifiers, random forests, extra-trees and XGBoost models – turned out to be very performant: it reduced our error rate to 12.9% and ranked us number 1 at that point!
Team n2
Place: 3rd
Home base: Singapore
n2's background: Tam T. Nguyen is a scientist working on machine learning and text mining in the data analytics department at Institute for Infocomm Research, A*STAR, Singapore. He is a data analytics project lead in banking and insurance including customer churn analysis, customer segmentation, and risk analytics.
Quy Nguyen is a data scientist at Crayon Data. Her work involves processing data and building machine learning algorithms. Besides work, her interest is doing modeling competitions to find new challenges and to learn from the best.
Method overview: We carried out intensive feature engineering on sensory data. We found that the historical signal is important to recognize the current activity therefore we generated many first and second-order lag features. We then trained dozens of models using various algorithms such as logistic regression, random forest, and extreme gradient boosting tree. Our final submission is an ensemble model of these base models.
Below is our feature engineering and modeling diagram.

Thanks again to all of our awesome participants, and congratulations to our winners! We hope you enjoyed getting to know them.
Finally, we'd like to extend our deep gratitude to AARP Foundation for their amazing support in sponsoring the competition! AARP Foundation works to ensure that low-income older adults have nutritious food, safe and affordable housing, a steady income, and strong and sustaining social bonds.
Do you have an idea for a DrivenData competition? Just want to say hi? We'd love to hear from you! Get in touch with us at info [at] drivendata.org.


