The motivation
Flooding is the most frequent and costly natural disaster in the world. According to the World Health Organization, between 1998 and 2017, floods affected more than two billion people worldwide. As global warming continues to exacerbate rising sea levels, prolong rainstorms, and increase snowmelt, the frequency and severity of extreme weather is only expected to rise.
During a flood event, it is critical that governments and humanitarian organizations be able to accurately measure flood extent in near real-time to strengthen early warning systems, assess risk, and target relief. Historically, hydrologists, governments, and emergency response teams have relied on readings from rain and stream gauging stations to understand flood reach and develop forecasts. Though helpful, these ground measures only measure water height, are spatially limited, and can be expensive to maintain.
High resolution synthetic-aperture radar (SAR) imaging has strengthened monitoring systems by providing data in otherwise inaccessible areas at frequent time intervals. Specifically, C-band SAR from the Sentinel-1 mission provides an all-weather, day-and-night supply of images of the Earth’s surface. By operating in the microwave band of the electromagnetic spectrum, SAR can capture images through clouds, precipitation, smoke, and vegetation, making it especially valuable for flood detection.
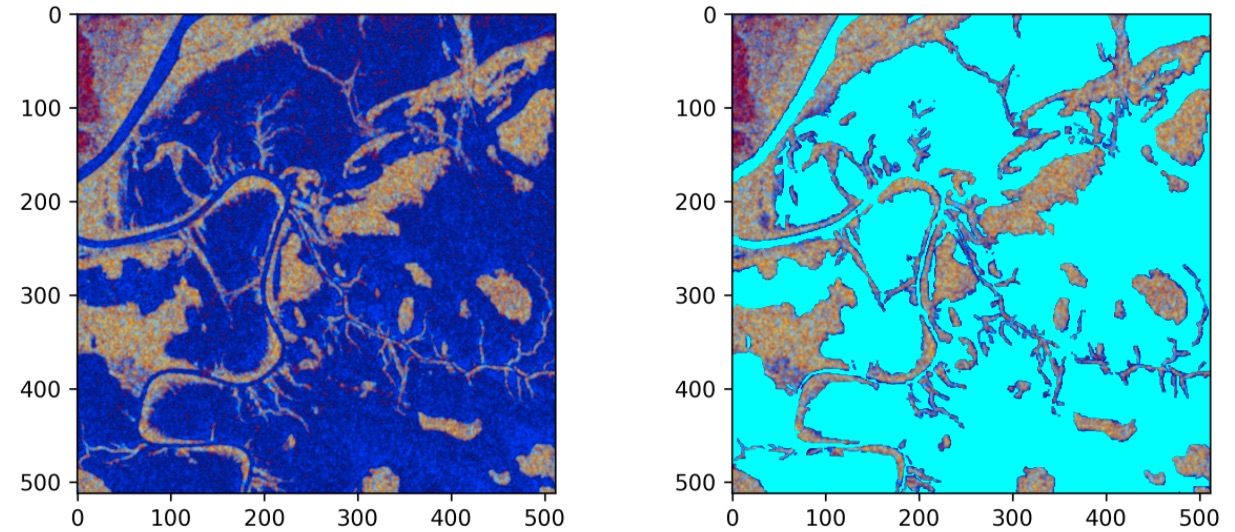
False color composite representing the VV and VH polarization bands of a SAR image alongside its water label from the competition dataset assembled by Cloud to Street and Microsoft AI for Earth
The goal of the STAC Overflow: Map Floodwater from Radar Imagery challenge was to build machine learning algorithms that can map floodwater using Sentinel-1 global SAR imagery. A newly updated dataset of satellite images captured between 2016 and 2020 was prepared and labeled by Cloud to Street and made available through Microsoft’s Planetary Computer. The Planetary Computer combines a multi-petabyte catalog of analysis-ready environmental data with intuitive APIs and a flexible development environment to support scientists, developers, and policy makers applying artificial intelligence to environmental challenges.
Models that can effectively use remote sensing to improve flood mapping have the potential to strengthen risk assessment, relief targeting, and disaster preparedness.
The results
Over 660 participants from around the world stepped up to this important challenge, generating more than 1,400 entries. To measure performance, we used a metric called Intersection over Union (IoU) or Jaccard Index, a common similarity measure that compares the size of the intersection relative to the size of the union for predicted and ground truth image pixels. At the start of the competition, DrivenData and Cloud to Street released a benchmark solution that used a ResNet-34 encoder and a U-Net decoder for semantic segmentation, which achieved an IoU of 0.44 on the test set. Within a week, multiple teams had already beaten this performance!
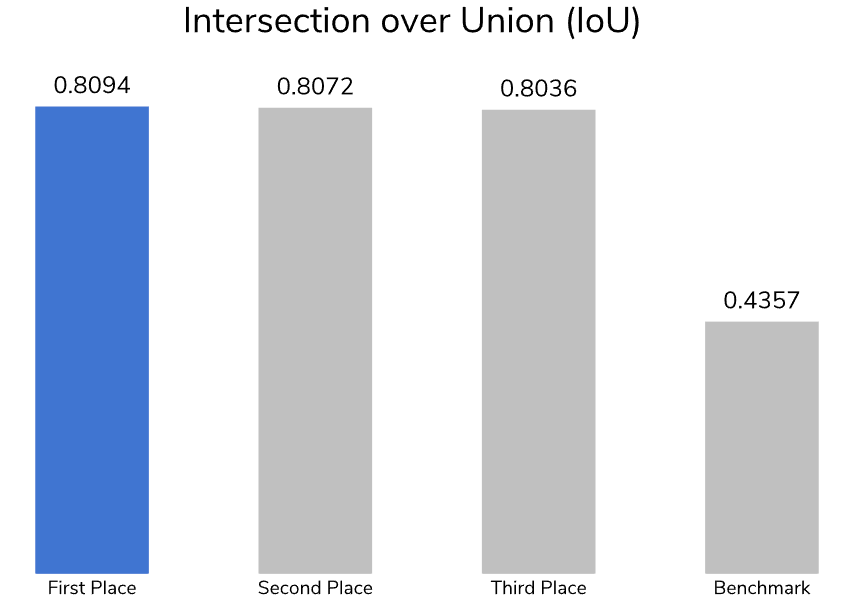
The top-performing models obtained IoUs above 0.80, demonstrating a significant improvement over the benchmark solution. They were able to capture signal from polarized SAR data across different geographies and vegetations. All winning solutions successfully leveraged the Planetary Computer STAC API to bolster their models using supplementary NASA Digital Elevation Model (NASADEM) elevation data and/or the European Commission’s Joint Research Centre (JRC) global surface water data to learn about a geography’s natural topography. To secure the top leaderboard positions, they used a combination U-Net and U-Net++ convolutional neural networks (CNNs) and gradient boosted decision trees.
In addition to using different models, competitors experimented with different sampling strategies, adversarial training schemes, and image augmentations to handle label imbalances and enhance the training dataset. As a result, these solutions can help to improve disaster risk management and response around the world by equipping response teams with more accurate and timely flood maps.
All of the prize-winning solutions from this competition are linked below and made available for anyone to use and learn from. Meet the winners and learn how they built their master mapping models!
Meet the winners
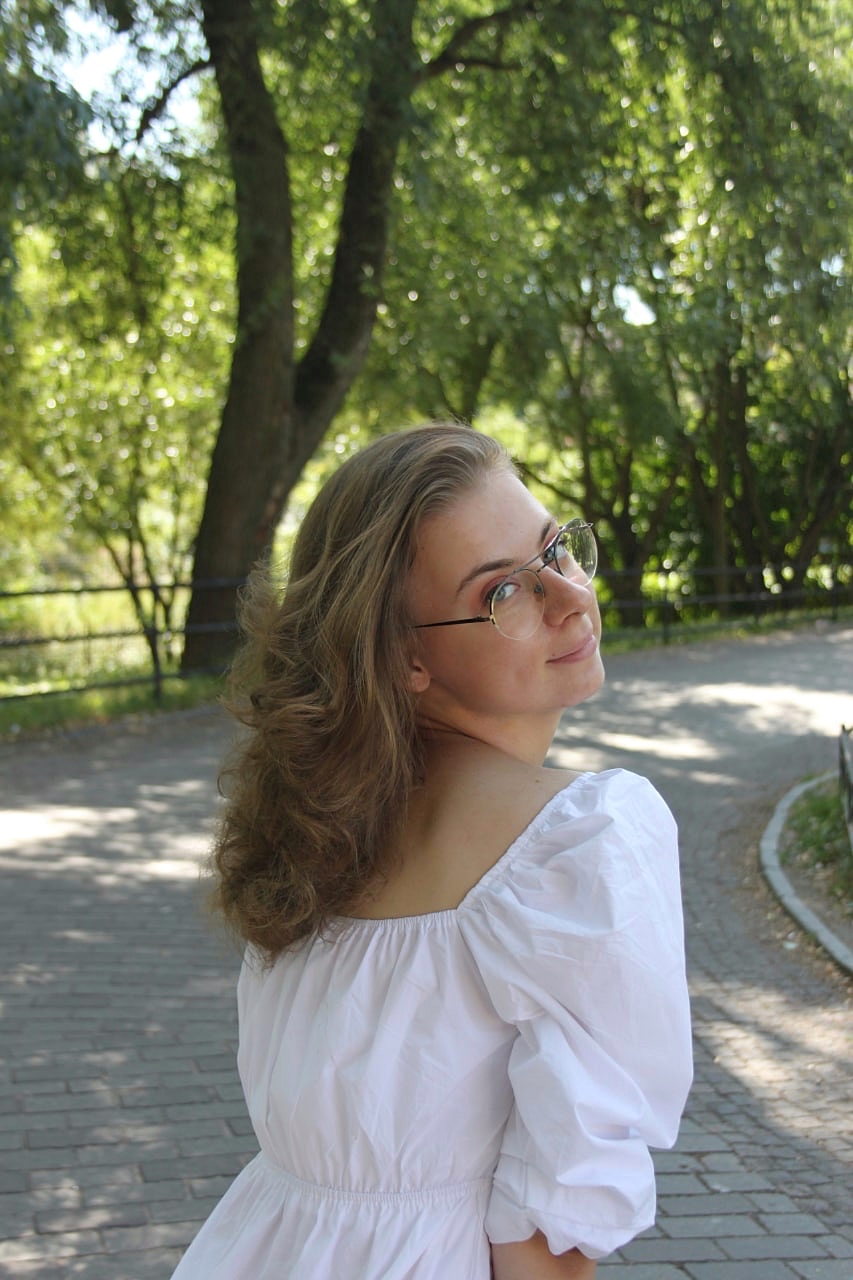
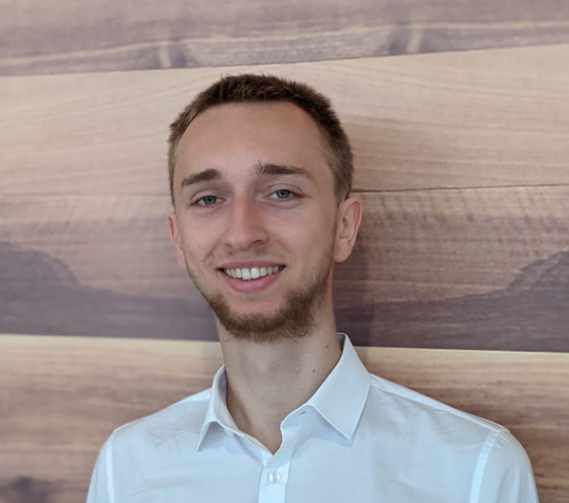
Daniil Stepanov and Anna Belyaeva

|
|
Place: 1st
Prize: $10,000
Hometown: Moscow, Russia
Username: sweetlhare, Belass
Background:
We are a team of two people from Russia. Anna leads the team and allocates time and resources. Daniil is responsible for developing the models. Together, we can outline and solve any task.
What motivated you to compete in this challenge?
We are fans of competitions and hackathons. Recently, many problems have involved computer vision and working with satellite images. When we saw this competition, we immediately decided to try it. We did not imagine that we would win until the last moment!
Summary of approach:
First, we trained a single U-Net model, as this is a classic approach for segmentation. Next, we studied articles that attempted to solve similar problems. We learned that flooding is often detected using mathematical formulas, which gave us the idea to try pixel-by-pixel classification by converting the images into tabular data. We noticed that both approaches helped to predict excess flooding but did not fill in all water pixels. Therefore, we decided to combine these two approaches by taking the maximum output value rather than the average. It was important to incorporate the NASADEM elevation band into our model. This was our final approach. The models are light enough that inference can be reproduced easily.
Check out team Moscow Hares’ full write-up and solution in the competition repo.
Max Lutz
Place: 2nd
Prize: $6,000
Hometown: Paris, France
Username: Max_Lutz
Background:
My name is Max Lutz. I’m a graduate from an engineering school in France at the Master’s level, where I specialized in energy and the environment. I have been studying data science and machine learning since March 2021. My goal is to work with data to help solve climate change and to work on projects that involve energy, the environment, and society.
What motivated you to compete in this challenge?
I was interested in this competition because the data and the objective are linked to the environment. Since my objective is to work with data to help solve climate change, it was a very good match. I thought it would be a very good opportunity to learn how to work with satellite data and how to make predictions using images.
Summary of approach:
My best solution includes the following steps:
- Load the ids of the VV and VH files
- Split the ids into a training set and a test set. I created three different splits so that I could train three models and average the output for prediction.
- Load the VV and VH images, labels, and auxiliary data files from the Planetary Computer. For the VV and VH images, clip the values outside of the range -30 to 0, map these values to 0-255, and convert to unit8. For the NASADEM images, clip the values outside of the range 0 to 255 and convert to unit8. For the rest of the data, do not apply any conversion.
- Use the albumentations library to generate new images from the original ones. Use RandomRotate90, HorizontalFlip, and VerticalFlip to produce random transformations, and append these new images to the original data.
- Train a U-Net model on the data using a loss function of dice loss with a squared denominator (I got the idea of using this loss function from this article).
Check out Max_Lutz’s full write-up and solution in the competition repo.
Will L.

Place: 3rd
Prize: $4,000
Hometown: Walpole, USA
Username: loweew
Background:
I am a biochemist who switched to computational work when I heard about CUDA in 2007. It seemed like it would be an important technology. I spent a few years as a research professor at Vanderbilt University leading a group developing novel, GPU-accelerated machine learning techniques for computer-aided drug design. I currently serve as the VP of Data Science at Lose It!, and as a user advisor to the TensorFlow team at Google.
What motivated you to compete in this challenge?
I had the week off from work and decided to use that time to learn PyTorch for segmentation. I came across the blog post for the competition and it seemed like a great place to start. I have been a prize winner in a couple of other DrivenData competitions and was already familiar with the great work they do.
Summary of approach:
My focus was really around building a generalizable ensemble. In my previous work on these types of competitions, I’ve found that my cross-validation models have suffered from hold-out variance issues. I tried to identify chip ids that contributed to this variation and kept them in the training folds during all cross-validation rounds. I figured that if the other chips could not generalize to those “outliers”, then it made sense to keep them in the training set and not try to use them for early stopping. I have found that using 5-fold cross-validation models as an ensemble or jury typically results in better generalization versus performing a final fit using the hyperparameters discovered through the cross-validation process. I used a variety of augmentations during training.
Check out the loweew’s full write-up and solution in the competition repo.
Thanks to all the participants and to our winners! Special thanks to Microsoft AI for Earth and Cloud to Street for enabling this important and interesting challenge and for providing the data to make it possible!


