The challenge
Getting better high-resolution snow water equivalent estimates for mountain watersheds and headwater catchments will help to improve runoff and water supply forecasts. This helps water managers better operate with limited water supplies and respond to extreme weather events such as floods and droughts.
David Raff, Chief Engineer, Bureau of Reclamation
Motivation
Seasonal mountain snowpack is a critical water resource throughout the Western U.S. Snowpack acts as a natural reservoir by storing precipitation throughout the winter months and releasing it as snowmelt when temperatures rise during the spring and summer. This meltwater becomes runoff and serves as a primary freshwater source for major streams, rivers and reservoirs. As a result, snowpack accumulation on high-elevation mountains significantly influences streamflow, water storage and allocation for millions of people.
The most commonly used measurement of snow water in water forecasts is snow water equivalent (SWE), a measure that combines information on snow depth and density. SWE refers to the amount of liquid water contained in a snowpack, or the depth of water that would result if a column of snow were completely melted.
Over the past several decades, ground-based instruments including snow course and SNOwpack TELemetry (SNOTEL) stations have been used to monitor snowpacks. While ground measures can provide accurate SWE estimates, ground stations tend to be spatially limited and are not easily installed at high elevations. Recently, high resolution satellite imagery has strengthened snow monitoring systems by providing data in otherwise inaccessible areas at frequent time intervals.
Given the diverse landscape in the Western U.S. and shifting climate, new and improved methods are needed to accurately estimate SWE at a high spatiotemporal resolution to inform water management decisions. That's where this contest comes in! The goal of the Snowcast Showdown challenge was to estimate SWE — in real-time each week — for 1km x 1km grid cells across the Western U.S.
Results
For the first time, this competition featured a real-time evaluation stage where predictions generated by participants each week were scored against new ground truth measures as they came in! In total, competitors were evaluated against over 42,000 ground truth SWE measurements spanning 20 weeks across the 2022 peak snow and melt seasons.
During the development phase, participants plowed through the challenging data engineering components and tested over 900 submissions using historical data. After the model freeze, 37 participants submitted weekly predictions for the real-time evaluation phase, which ran from February through June.
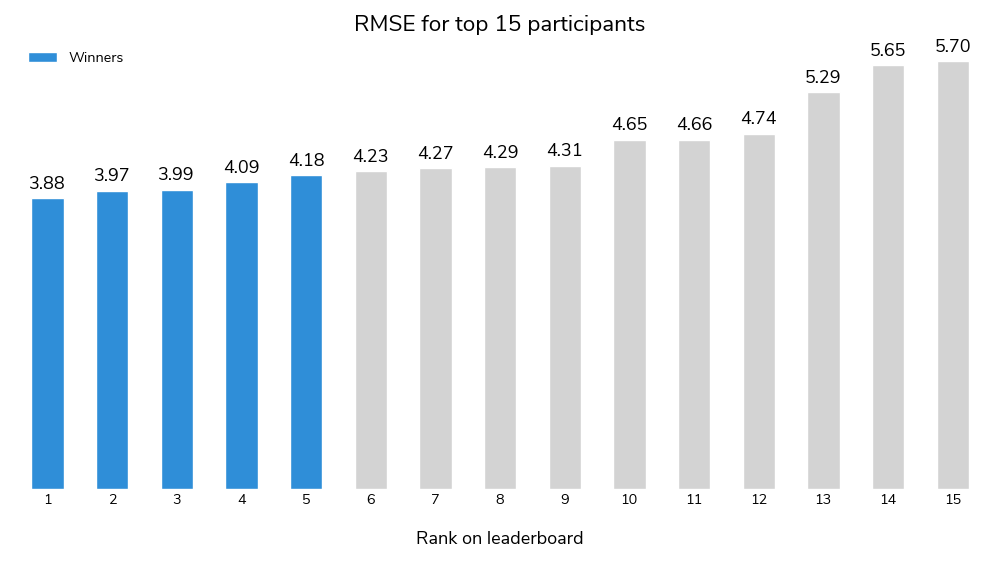
The top model achieved an impressive RMSE of 3.88 and an R-squared of 0.70. Competition was tight, with the top five scores all within a narrow 0.3 range.
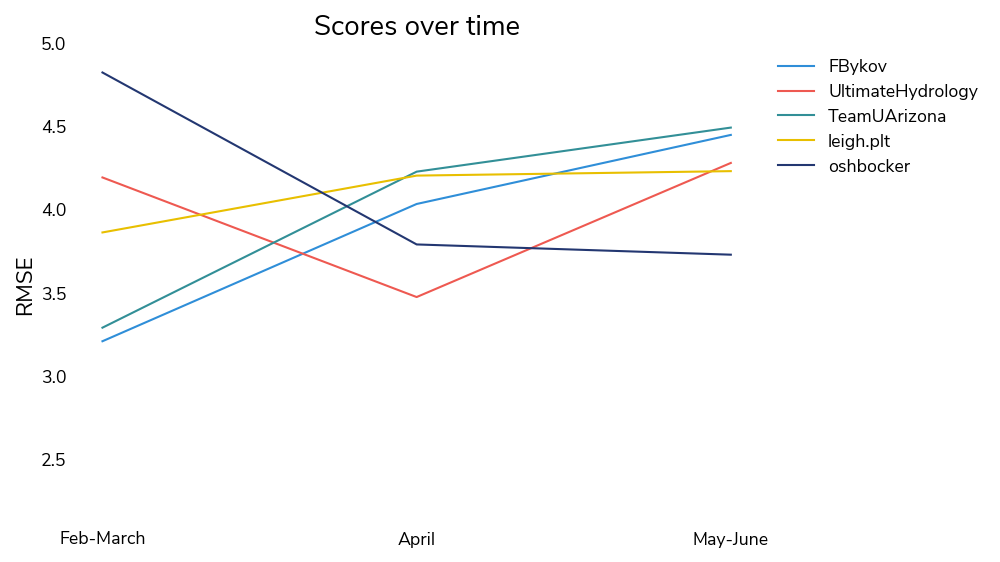
Winning solutions performed differently across the peak snow and melt seasons. First and third place did best in February and March, while second place scored best in April, and fifth place performed best in May and June.
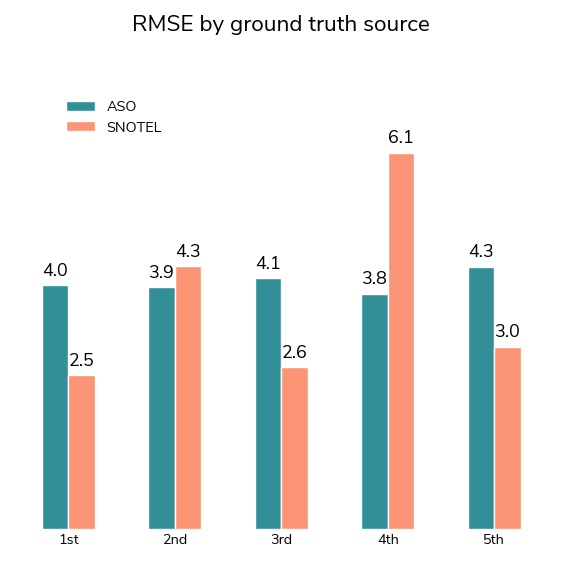
The real-time SWE measurements came from two difference sources: ground measure stations and ASO flights.
-
SNOTEL and CDEC stations measure SWE using a technology called a snow pillow, which uses a flexible bladder filled with antifreeze to convert fluid pressure into weight. These stations provide continuous readings throughout the snow accumulation and runoff seasons, but are spatially limited and can face challenging maintenance issues. In this challenge, ground measures from SNOTEL and CDEC stations were used both as an optional input data source and in ground truth labels for this competition. Sites used for evaluation were entirely distinct from those in the features data. This allowed models to incorporate and benefit from available weekly ground measures as inputs while reserving distinct ground truth for evaluation.
-
The Airborne Snow Observatory (ASO) methodology uses an aircraft-based imaging spectrometer to measure differences between snow-covered and snow-free surfaces. ASO combines lidar-derived snow depth with albedo estimates to model SWE at a high level of accuracy, though flight timing and coverage is not guaranteed. ASO flights can also capture higher elevation areas compared to ground measure stations.
Over the course of the real-time evaluation period, submissions were evaluated against ~39,000 ASO ground truth measurements and ~3,600 SNOTEL ground truth measurements. Given the dominance of the ASO data in the evaluation set, improvements on the SNOTEL data needed to be sizable to affect overall leaderboard standings.
Although the competitors used various methods and data sources, there were a few overarching takeaways:
-
Feature engineering is key: All of the winning solutions used significant feature engineering. This ranged from more standard rolling statistics and historical averages to particularly creative features such as whether the slope in the grid cell received Southern sun exposure (with the idea that snow on South facing slopes melts faster in the Northern hemisphere).
-
Hold the GPU: Despite the sizable lift in downloading and extracting features from satellite and weather data, the models themselves were relatively lightweight. Winner approaches included regression models, tree-based models, and simple multi layer perceptrons, many of which performed inference quickly and without the need of a GPU. Speedy inference bodes well for operationalizing models and predicting over larger geographical areas.
-
Static sources provide value: Even in a real-time prediction competition, some winning solutions utilized static data sources that were requested by users during the development phase. This included the Digital Elevation Model (DEM), the FAO-UNESCO Global Soil Regions Map, and the CRDP Water Bodies Map. Still, the real-time satellite (MODIS) and weather (HRRR) data were the most commonly used data sources.
To learn more about each of the peak approaches, read on! The code for each winning submission along with the winning modeling reports are available in our open-source competition winners repository.
Meet the winners
| Place | Real-Time Prediction | Modeling Report | Sierras Regional Prize | Central Rockies Regional Prize |
| 1st Place | FBykov | oshbocker | leigh.plt | UltimateHydrology |
| 2nd Place | UltimateHydrology | UltimateHydrology | FBykov | oshbocker |
| 3rd Place | TeamUArizona | TeamUArizona | UltimateHydrology | leigh.plt |
| 4th Place | leigh.plt | |||
| 5th Place | oshbocker |
Filipp B. and Polina V.
Place: 1st
Prize: $170,000
- 1st place for real-time prediction
- 2nd place for Sierras regional prize
Hometown: Moscow, Russia and Kenilworth, UK
Username: FBykov
Background
Filipp: I am a mathematician and data scientist. I have recently defended my PhD, a study of the structure of errors in numerical model forecasting. Currently I work in a private company as a data scientist in the broad area of environmental sciences, mainly with the Earth system data. The questions which attract me most are those where machine learning can be used to understand physical processes.
Polina: I am a mathematician and a researcher, working in a broad area of dynamical systems. This is a branch of mathematics which aims to predict the future of physical systems using simplified, sometimes idealistic models. I particularly enjoy interdisciplinary problems where the methods and ideas from one field can be applied in another, seemingly unrelated at first sight.
What motivated you to compete in this challenge?
This challenge is related to the thoughtful consumption of renewable resources. I strongly believe that my solution will be useful for improving the water resource management. The given problem is very close to my scientific interests. I have a good theoretical background and practical skills in mathematics, statistics and data science.
Summary of approach
The problem is equivalent to the question of interpolation of the snow water equivalent (SWE) measurements in CDEC and SNOTEL stations to produce the SWE in grid cells. Kriging (also known as Gaussian process regression) considers this as a regression problem with respect to nearest known SWE values and uses the estimates of the mean, the spread, and the structural function. It follows from the reproducing kernel Hilbert space theory that any inhomogeneous structural function is equivalent to a homogeneous kernel in the latent space.
In my approach, the neural networks (two layers perceptrons) are used to estimate the mean, the spread, and the mapping in latent space. This perceptrons take into account all features. The final result is a mix of 63 inhomogeneous kriging models. The models have 8 different configurations and use different train-validation splitting.
Check out FBykov's full write-up and solution in the competition repo.
Evgenii Malygin, Maksim Kharlamov, Ivan Malygin, Maria Sakirkina, and Ekaterina Rets
Place: 2nd
Prize: $135,000
- 1st place for Central Rockies regional prize
- 2nd place for real-time prediction
- 2nd place for modeling report
- 3rd place for Sierras regional prize
Hometown: Moscow, Russia and Warsaw, Poland
Usernames: Vervan, IvanMalygin, kharlamov, Ekaterina.Rets, masakirkina
Background
Evgenii Malygin: I graduated from the Department of Hydrology at Lomonosov Moscow State University in 2015. Then in 2018 I graduated from Lomonosov MSU Postgraduate School of Geosciences. For the last two years, I have been working as a data scientist at MegaFon (top cellular operator in Russia) at the department of Big Data Analytics and Machine Learning.
Maksim Kharlamov: I am a hydrologist and junior researcher in Lomonosov Moscow State University. At work, I am developing ML forecasts for extreme hydrological events: floods, droughts, ice jams, etc. My best friends are meteorological and satellite data. In love with CatBoost.
Ivan Malygin: I've graduated from Mathematics faculty of Lomonosov Moscow State University, the Chair of intellectual systems. I work professionally in data analysis and modeling in various fields, such as economics and geosciences.
Maria Sakirkina: Professional cartographer (Lomonosov Moscow State University, Russia), I work mainly with geographic information systems. I have been processing remote sensing data for forests, agriculture, and other natural resources for 10 years.
Ekaterina Rets: 14 years’ experience in Hydrology, Glaciology and Civil Engineering. PhD in Hydrology since 2013. Currently employed at Institute Institute of Geophysics Polish Academy of Sciences. My research interests have been focused on functioning of river catchments and response of hydrological systems to climate change across different scales from small alpine catchments to mountain systems and vast regions.
What motivated you to compete in this challenge?
Evgenii Malygin: I like to participate in competitions that are close to research tasks, where you have to think, get into the problem, engineer features, and not just stacking XGBboost. It was a great challenge at the intersection of hydrology, Earth science, and machine learning.
Maksim Kharlamov: I am a fan of competitions and hackathons, and this task is a perfect mix of ML, data engineering and hydrology! So, this hackathon is a great opportunity to apply maximum knowledge from various fields to solve this task. Hope I can use this experience in my scientific research.
Ivan Malygin: As a hobby, I enjoy data mining and machine learning competitions. This allows me to be in trend of modern science and algorithms and use the experience gained in my main work.
Maria Sakirkina: An interesting challenge related to the professional profile of the participants. The need to prepare the data from scratch, automating the process from downloading the data to obtaining the result of the prediction.
Ekaterina Rets: Estimation of the spatial distribution of snow water equivalent in mountainous areas is currently one of the most important unsolved problems in snow hydrology. That makes it fascinating to contribute my knowledge to try to solve this task for the Western US. I was excited to carry out that research in a very strong interdisciplinary team and compete with specialists all around the globe.
Summary of approach
The solution is based on different SOTA implementations of Gradient Boosting Machine algorithm: XGBoost, LightGBM, and CatBoost, and their ensembles. The target dataset based on SNOTEL, CDEC and ASO LiDAR data was provided by the contest organizers. The top features of 121 features set included ground snow measure data (SNOTEL, CDEC), and remote sensing of snow cover (MODIS Terra MOD10A1). The top 1-4 features include as well physically-based indirect predictors of SWE: seasonal cumulative sum of solid precipitation, seasonal average values of air temperature and the mean seasonal value of solar radiation. Terrain parameters characterizing spatial differences in incoming solar radiation display a substantial level of importance, especially aspect characteristics. Integration of the energy balance snow model was tested but not included in the final solution due to low calculation speed exceeding the contest limitations (8 hours inference time). An end-to-end solution and automated real-time forecast pipeline were developed to reproduce the forecast for each week.
Check out team UltimateHydrology's full write-up and solution in the competition repo.
Patrick Broxton, Xubin Zeng, Ali Behrangi, and Guo-Yue Niu

Place: 3rd
Prize: $60,000
- 3rd place for real-time prediction
- 3rd place for modeling report
Hometown: Tucson, AZ
Usernames: broxtopd, abehrang, niugy, xubin
Background
Dr. Patrick Broxton is an Assistant Research Professor in the School of Natural Resources and the Environment at the University of Arizona.
Dr. Xubin Zeng is the Agnese N. Haury Chair in Environment, Professor of Atmospheric Sciences, and Director of the Climate Dynamics and Hydrometeorolgy Collaborative at the University of Arizona.
Dr. Niu is an associate professor of hydrometeorology, land surface modeler, and associate editor of Water Resources Research.
Dr. Ali Behrangi is a University of Arizona Distinguished Scholar and Professor of Hydrology and Atmospheric Sciences.
What motivated you to compete in this challenge?
We have been researching snowpack for many years and are highly motivated to improve snowpack monitoring in the Western US and elsewhere. Furthermore, we have, and continue to be interested in estimating Snow Water Equivalent (SWE) over large areas from sparse station data.
Summary of approach
Our codes use Multilinear Regression (MLR) models to predict SWE for grid cells across the Western US based on the provided snow station data. Models are trained to predict either ground measurements of SWE (if there are enough measurements for a particular grid cell), or SWE data taken from a gridded SWE dataset called the University of Arizona (UA) SWE dataset (if they are not). In addition to the MLR models, there is also code to fill missing snow station predictor data and to perform some bias correction of the models if necessary. Ultimately, model predictions are made by averaging an ensemble of MLR models.
One of the most important aspects of our solution is how it fills missing data (by incorporating the UA SWE data during model training, as well as filling missing predictor data during both model training and model inference). During model training, we chose to incorporate UA SWE data because UA SWE does a good job estimating SWE across larger regions (i.e. making it useful to estimate how SWE at unknown locations should relate to SWE at the predictor stations). In addition, we developed an innovative approach to fill the missing snow station data based on data from other nearby snow stations. We tried a few different machine learning methods but ended up using MLR because it was stable and provided adequate results over a wide range of conditions. We trained our algorithm to maximize its performance over the whole western U.S., rather than for individual regions.
Check out TeamUArizona's full write-up and solution in the competition repo.
Oleksii Poltavets
Place: 4th
Prize: $65,000
- 1st place for Sierras regional prize
- 3rd place for Central Rockies regional prize
- 4th place for real-time prediction
Hometown: Zaporizhzhia, Ukraine
Username: leigh.plt
Background
I'm from Ukraine, I work as a freelance data scientist. I regularly participate in various online competitions.
What motivated you to compete in this challenge?
I took part in weather-themed competitions, so I decided to take part in this competition as well, having some experience with the topic.
Summary of approach
The data consist of a variety of data sources. To do this, we decided to use a neural network model with different layer architectures: Fourier neural operator (FNO), convolution layers, embeddings, and linear transformation. This architecture allows us to combine data of different nature: images, historical data and classification labels. Also FNO can decrease the influence of errors in the data.
Check out leigh.plt's full write-up and solution in the competition repo.
Matthew Aeschbacher

Place: 5th
Prize: $70,000
- 1st place for modeling report
- 2nd place for Central Rockies regional prize
- 5th place for real-time prediction
Hometown: Denver, Colorado
Username: oshbocker
Background
I am a Machine Learning Engineer at Uplight Inc., a software company that works with energy utilities to engage customers in new ways for the more efficient use of energy. I received a Masters in Analytics from Georgia Institute of Technology. I enjoy learning about software engineering, machine learning, and physics.
What motivated you to compete in this challenge?
I am always looking for ways to apply machine learning to interesting and impactful problems. Growing up in Denver, CO I have been fascinated by the mountains my whole life and observed first-hand mountain snow conditions while skiing and hiking in the mountains. Only recently have I realized the importance of mountain snowpack to the sustainability of water resources in the Western United States. This challenge allowed me to practice my data engineering and machine learning skills, learn about satellite and weather data, and create a solution that could help water resource managers make decisions that positively impact water scarcity in the Western United States.
Summary of approach
I took a data-centric approach of trying to incorporate as many useful features as possible in a gradient boosting model. Because of this, my approach was more heavily reliant on feature engineering. I used the Modis NDSI data, several values from the HRRR climate data, the DEM (Digital Elevation Model), and the ground measures.
Since gradient boosting naturally works with tabular data, I used the mean and in some cases the variance of pixel values from the Modis data and the DEM over an entire grid cell. If you eliminate Modis data for a grid cell on days with high cloud cover (recommended) the Modis data becomes sparse, so the Modis features I created used a rolling average of the mean pixel values, one 5-day rolling average, and one 15-day. Modis derived features were most important according to my feature importance analysis.
I found the DEM very helpful. Just using the mean and variance of elevation for a grid cell was a useful feature. I also created a feature that I called southern gradient that took the difference between north-south pixels and represents southern exposure for a grid cell, with the idea that snow on South facing slopes melts faster in the Northern hemisphere.
Geo-spatial and time based features were important. I created a feature I called “snow season day” that just counted the days from the beginning of the snow season, November 1, until the last day, June 30. I also just fed in the raw lat and lon as features; I tried fuzzing a little and it may have helped with generalization, but very minimally in my experiments.
The way I incorporated the ground measures was to use the relative SWE, compared to historical average for a ground measure station. Then for each grid cell I took the 15 nearest neighbors relative SWE. That feature reduced the RMSE a bit more.
The usefulness of the HRRR climate data was a little more perplexing to me. I used a three day rolling average for different values (temperature, WEASD - snow water accumulation, snow depth, pressure, precipitation, etc). In the absence of some of the other features the HRRR data provided value but with all the other features the model remained flat (RMSE didn’t improve). I included it for robustness, as there was a period last month where the Aqua Modis dataset was unavailable for over half a month.
I used an ensemble of three different gradient boosting implementations, LightGBM, XGBoost, and Catboost. LightGBM performed the best on its own, and it was the fastest to train. You always hear about XGBoost being good for data science competitions but I came away very impressed with LightGBM.
Check out oshbocker's full write-up and solution in the competition repo.
Thanks to all the participants and to our winners! Special thanks to Bureau of Reclamation for enabling this important and interesting challenge!