Accurate seasonal water supply forecasts are crucial for effective water resources management in the Western United States. This region faces dry conditions and high demand for water, and these forecasts are essential for making informed decisions. They guide everything from water supply management and flood control to hydropower generation and environmental objectives.
Yet, hydrological modeling is a complex task that depends on natural processes marked by inherent uncertainties, such as antecedent streamflow, snowpack accumulation, soil moisture dynamics, and rainfall patterns. To maximize the utility of these forecasts, it's essential to provide not just accurate predictions, but also comprehensive ranges of values that effectively convey the inherent uncertainties in the predictions.
In the Water Supply Forecast Rodeo, participants were tasked with developing accurate water supply forecast models for 26 sites across the Western United States. This was a probabilistic forecasting task—models needed to predict not just a point estimate for the water supply volume but also uncertainty bounds. Specifically, participants were asked to predict the 0.10, 0.50, and 0.90 quantiles of the water supply.

Results of the Hindcast Stage
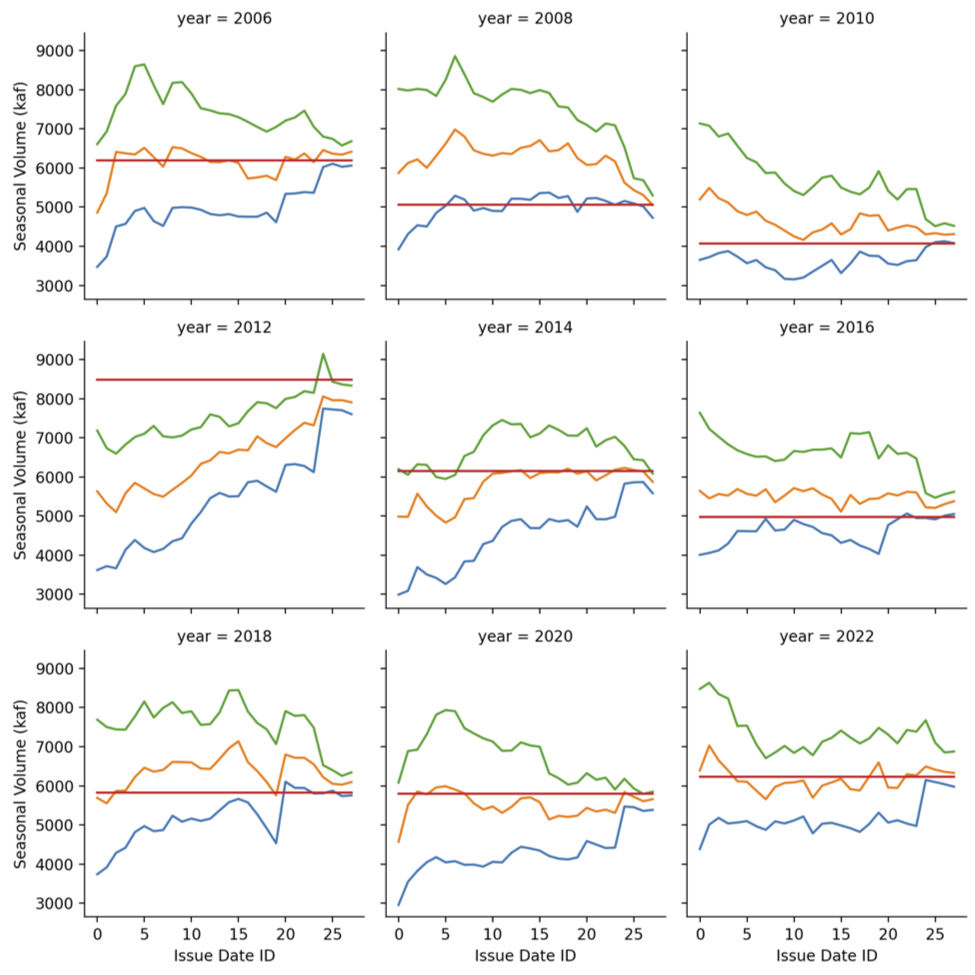
The Water Supply Forecast Rodeo is being held over multiple stages from October 2023 through July 2024. In the Hindcast Stage—the first stage of the challenge—participants developed forecast models that were evaluated against 10 years of held out historical data. The models were required to generate predictions four times a month for each site, from January through July. Each forecast targeted the cumulative seasonal volume: one value for each site and each year.
Participants were required to submit working code that was executed to performance inference on a holdout test set of 10 years of data. Over the course of the Hindcast Stage, 64 teams submitted predictions in the development arena and 29 teams submitted successful code submissions.
To be considered for a prize, teams also had to submit a model report detailing their methodology in order to be considered for prizes. Twelve teams submitted model reports to be considered for the Hindcast Stage prizes. A judging panel of hydrologists from the Bureau of Reclamation, the Natural Resources Conservation Service, and NOAA's River Forecast Centers selected winners based on a combination of their models' forecast skill and an evaluation of the rigor of their modeling methodology.
The three winners from the evaluation process also turned out to be the top three scores on the leaderboard, with average quantile loss scores of 87.8, 90.8, and 101.6 thousand acre-feet of water, respectively. Quantile loss, also known as pinball loss, is a generalization of mean absolute error to predicting quantiles, with the 0.50 quantile case being mean absolute error exactly.
Below are some interesting observations about the winning solutions:
- Snow water equivalent, precipitation, and observed streamflow are leading data sources. All of the winners used snow water equivalent (a measurement of snowpack volume) observations, precipitation measurements, and features derived from to-date streamflow observations from the season. This is not surprising, as snowmelt and precipitation are known to hydrologists as the most important inputs to the water supply. Other features, such as temperature and elevation, were used as well. Other data sources were experimented with, and teams expressed that they would continue to experiment with data sources in the following competition stages.
- Tree-based models were popular but not exclusive. Gradient-boosted trees were popular modeling algorithms among the teams that submitted model reports, including the first- and third-place winners. However, the second-place team found success with a multilayer perceptron model.
- Common models for all sites with
site_idas a feature. One key modeling decision is whether to model all 26 sites together. Pooling the sites gives more data, but modeling them separately can help account for major geographic and climatological differences between them. All three winners chose a mixed approach by training models with a common set of weights for all sites, but withsite_idas a feature. For tree-based and neural network models, this allows the model to learn a mix of shared and per-site internal representations and responses to features. - Different approaches to modeling uncertainty. The first- and third-place winners, who used tree-based models, trained separate models to predict the 0.10, 0.50, and 0.90 quantile forecasts. In contrast, the second-place winner, who used a multilayer perceptron, predicted all three values with a single model.
Meet the Winners
| Prize | Name |
|---|---|
| 1st place | Rasyid Ridha (rasyidstat) |
| 2nd place | Roman Chernenko and Vitaly Bondar (Team ck-ua) |
| 3rd place | Matthew Aeschbacher (oshbocker) |
Rasyid Ridha

Place: 1st
Prize: $25,000
Home country: Indonesia
Username: rasyidstat
Background:
Experienced Data Scientist specializing in time series and forecasting. Currently working in the IoT domain, focusing on elevating consumer experience and optimizing product reliability through data-driven insights and analytics. Previously worked in various tech companies in Indonesia.
What motivated you to compete in this challenge?
I was motivated to compete in this challenge because of its unique setup. Unlike typical data science competitions, there's no predefined training dataset provided. This means participants must not only focus on modeling but also on finding the right data to be used. Additionally, the requirement to submit operational code adds another layer of complexity and practical application. I saw this as an exciting opportunity to test and expand my machine learning skills in a practical, real-world setting.
Summary of approach:
Ensembles of LightGBM models with Tweedie loss for point forecast and quantile loss for 0.10 and 0.90 quantile forecast. Data sources used for the Hindcast stage model are SNOTEL SWE, USGS, and USBR observed flow. Since the dataset is small based on the number of available training years for each site and issue date, synthetic data generation is applied to increase the training sample size by 5x, which significantly improves forecast skill, prediction interval reliability, and generalizability.
Check out Rasyid's full write-up and solution in the challenge winners repository.
Roman Chernenko and Vitaly Bondar


Place: 2nd
Prize: $15,000
Hometown: Cherkasy, Ukraine
Team name: ck-ua
Usernames: RomanChernenko, johngull
Social Media: /in/roman-chernenko-b272a361/, /in/vitalybondar/
Background:
Roman Chernenko: Machine Learning Engineer in Agreena ApS company with 4 years of experience in ML for geospatial applications, satellite imaging and precision agriculture. Also, I have 10 years of experience with C++ cross-platform development, especially in the medical imaging domain, and for embedded solutions.
Vitaly Bondar: ML Team lead in theMind (formerly Neuromation) company with 6 years of experience in ML/AI and almost 20 years of experience in the industry. Specialises in the CV and generative AI.
What motivated you to compete in this challenge?
The main motivation is a complicated, interesting challenge with a significant prize amount. Also, we participated in a similar challenge "Snowcast Showdown" at DrivenData 2 years ago and finished 6th.
Summary of approach:
Our approach centered on using a Multi-Layer Perceptron (MLP) neural network with four layers, which proved to be the most effective within the given constraints. The network was constructed to simultaneously predict the 10th, 50th, and 90th percentile targets of water level distribution. We experimented with various network enhancements and dropout regularization but observed no substantial improvement in the model's performance. For our data sources, we relied on the NRCS and RFCs monthly naturalized flow, USGS streamflow, and NRCS SNOTEL data, all of which were meticulously normalized and encoded to serve as features for our training process. We propose a novel approach for using SNOTEL data by training specialized RANSAC mini-models for each site separately. For each of these mini-models the list of the used SNOTEL stations are selected by heuristic approach.
Check out Team ck-ua's full write-up and solution in the challenge winners repository.
Matthew Aeschbacher

Place: 3rd
Prize: $10,000
Hometown: Denver, Colorado, USA
Username: oshbocker
Social Media: /in/matthewpaeschbacher/
Background:
I work as a Senior Machine Learning Engineer for Uplight, Inc. where I build production machine learning systems that help orchestrate energy assets on the electric grid.
What motivated you to compete in this challenge?
Growing up and living in Denver, Colorado, I have long been aware of the importance of seasonal streamflow to communities across the Western United States. I wanted to take this opportunity to learn more about the dynamics that shape streamflow from season to season and help give back to the community.
Summary of approach:
Using historical data from 26 different hydrologic sites we created an ensemble of gradient boosting models that provide a probabilistic forecast for the 0.10, 0.50, and 0.90 quantiles of cumulative, seasonal streamflow volume. There are two model architectures underlying the solution, both based on the Catboost implementation of gradient boosting on decision trees. The first model architecture predicts the quantiles of total cumulative streamflow volume in each season, for each site. The second model architecture predicts the quantiles of monthly cumulative streamflow volume within the season, for each site. The monthly predicted quantiles are then summed over the season to give the seasonal streamflow volume. The models use static features from each site including, the latitude, longitude, elevation, and categorical site id. The models also use dynamic features including, the day of the year, and features derived from localized precipitation, temperature, streamflow measurement from streamgages, and snow water equivalent measurements. The quantile predictions from each model are combined using a weighted average to minimize the prediction error given by the mean quantile loss across the three quantiles.
Check out Matthew's full write-up and solution in the challenge winners repository.
Looking ahead
Be on the lookout for more Water Supply Forecast Rodeo results coming later this year! Here's a quick look at the remaining stages of the challenge:
- Forecast Stage: Models are being run four times each month from January through July 2024 to issue near-real-time forecasts for the 2024 season. Forecast skill will be evaluated in August when the ground truth data becomes available.
- Final Prize Stage: Refined models are being evaluated once again on historical data but using a more robust cross-validation procedure. Prizes will be awarded based on a combination of cross-validation forecast skill, forecast skill from the Forecast Stage, and evaluation of final model reports.
- Explainability and Communication Bonus Track: Teams will produce example forecast summaries—short documents that communicate and explain forecasts to water managers, the general public, and other potential consumers of forecasts.

Thanks to all the participants and to our winners! Thanks also to Bureau of Reclamation for sponsoring this challenge, and our other collaborators from the Natural Resources Conservation Service, the U.S. Army Corps of Engineers, and the NASA Tournament Lab. Special thanks to the judging panel: Ian Ferguson (USBR), Christopher Frans (USBR), Christian Gnau (USBR), Kevin Foley (NRCS), Paul Miller (NOAA CBRFC), and Alexander Chen (NOAA CNRFC).
Thumbnail and banner image is a photograph of Bumping Lake in Washington State. Image courtesy of USBR.