
The Challenge
This University Challenge was a great opportunity for us to work with University teams that we otherwise wouldn't have been able to. By crowdsourcing this problem to the University community, we've been able to learn about a variety of innovative approaches, while also providing an open dataset that anyone can use in their research. Tim Scott, Research Computer Scientist, NASA Langley Research Center
Motivation
Coordinating our nation’s airways is the role of the National Airspace System (NAS). The NAS is arguably the most complex transportation system in the world. Operational changes can save or cost airlines, taxpayers, consumers, and the economy at large thousands to millions of dollars on a regular basis. It is critical that decisions to change procedures are done with as much lead time and certainty as possible. The NAS is investing in new ways to bring vast amounts of data together with state-of-the-art machine learning to improve air travel for everyone.
An important part of this equation is airport configuration, the combination of runways used for arrivals and departures and the flow direction on those runways. For example, one configuration may use a set of runways in a north-to-south flow (or just "south flow") while another uses south-to-north flow ("north flow"). Air traffic officials may change an airport configuration depending on weather, traffic, or other inputs.
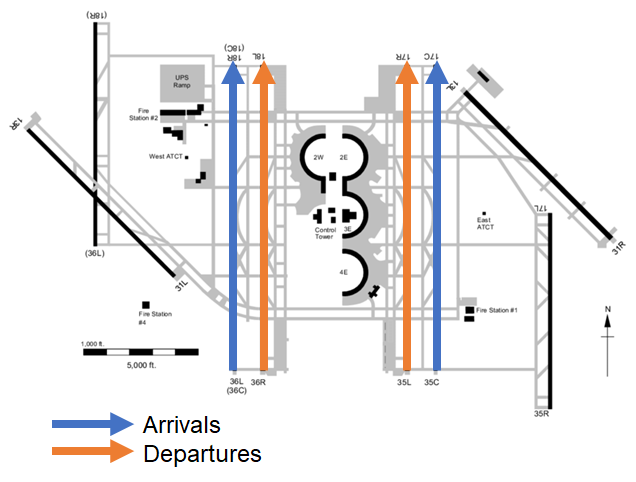
Sample of a basic airport configuration, depicting a set of runways configured in a north flow for arrivals and departures.
These changes can result in delays to flights, which may have to alter their flight paths well ahead of reaching the airport to get into the correct alignment or enter holding patterns in the air as the flows are altered. The decisions to change the airport configuration are driven by data and observations, meaning it is possible to predict these changes in advance and give flight operators time to adjust schedules in order to reduce delays and wasted fuel.
In this challenge, participants tried to predict how an airport would be configured up to six hours in the future using features that capture air traffic and weather conditions. The goal was to build a model that predicts the probability of possible configurations, looking ahead every 30 minutes for the next 6 hours. Participants had access to a year's worth of data, including observed traffic at the level of individual flights, fine-grained estimates of arrivals and departures, and state-of-the-art weather forecasts.
Results
This was a university challenge! The challenge started off with an open arena, where hundreds of participants signed up and tested over 250 submissions. U.S. university-affiliated participants were eligible to enter the second phase, in which participants could refine their model on the entire training set and package their model code for final evaluation on a brand new, out-of-sample dataset collected between May-June 2022.
At the start of the competition, DrivenData developed two benchmarks: a No change forecast that predicted the current configuration for all future timepoints and a Recency-weighted historical forecast that took the recently active airport configurations into account. The simplicty of these approaches belies their effectiveness in a dataset characterized by long periods during which the airport configuration is unchanged. Here are the results in terms of mean aggregated log loss, the metric by which we ranked the submissions:

All four winners outperformed the No change forecast, and the top three outperformed the stronger Recency-weighted historical forecast. Log loss has certain useful properties, such as its ability to account for predictions of varying confidence, and the fact that many models can optimize it directly. However, it is often helpful to evaluate model performance using alternative metrics, which can provide additional insight into how the models perform. We will start with the model accuracy, or simply how often the model predicts the correct configuration. Here we plot accuracy by lookahead for the top two solutions alongside the No change forecast, shown separately for each airport:

It is clear that one of the largest factors to performance is lookahead. Not surprisingly, it is more difficult to predict the airport configuration 6 hours from now than 30 minutes from now. On average, the 1st and 2nd place winners show substantial improvements over our benchmark at longer lookaheads. Another major factor to performance is the airport itself, each of which has its own unique characteristics. To start, airports may differ in the number of configurations available, or might experience different weather patterns that lead to more frequent and/or less predictable changes in airport configuration. In our results, we see that configurations at KDEN (Denver) is particularly difficult to predict; the winning models perform about the same as the benchmark there.
Another important view of performance is how well models are able to predict changes in airport configuration. As impressive as it is to be able to predict that the current configuration will still be in place hours in the future, an important operational consideration is when the configuration will change. First let's look at exactly how often that happens. Here we show the probability that the airport configuration will change in the next lookahead minutes.

Again, this varies widely by airport, but in general as time goes on, it is more likely that the configuration will change. If we focus solely on a model's ability to forecast upcoming configuration changes, we can analyze model performance through the lens of recall and precision. To start, we'll define an "actual change" as an instance where the actual configuration at a lookahead is different from the current actual configuration, and we'll define a "predicted change" as an instance where the model's top predicted configuration at a lookahead differs from the current actual configuration. Then, consider true positives as actual changes that the model predicts correctly (among its top k guesses), false negatives as actual changes that the model predicts incorrectly (not among its top k guesses), and false positives as predicted changes that are incorrect (e.g., the actual configuration is not among the model's top k guesses).
Now we can ask two questions: first, how often does a model predict the correct configuration for timepoints where the airport configuration actually changed (recall, or the proportion of true positives over all actual changes); second, when the model predicts a change from the current configuration, how often is it correct (precision, or the proportion of true positives over all predicted changes)? Note that the No change forecast is not very helpful here; since it never predicts a change from the current configuration, recall is always 0, and precision is not defined. Instead, we'll introduce a Random forecast baseline that randomly guesses a configuration.

Recall and precision metrics for the 2-hour lookahead with k of 1 and 3.
Metrics like these help us develop an intuition of a model's real-world utility. For example, the Change recall plot shows that the 1st place model correctly forecasts the exact configuration for an average of 41% of configuration changes that occur 2 hours from now. The Change precision plot shows that when the 1st place model predicts that the configuration will change 2 hours from now, it correctly guesses the exact configuration 49% of the time on average. The Random forecast baseline drives home how difficult this task is!
Now, let's get to know our winners and how they created such successful airport configuration models! You can also dive into their open source solutions in the competition winners repo on Github.
Meet the winners
| Prize | Name |
|---|---|
| 1st place | Kristin Mullaney & Alejandro Sáez |
| 2nd place | Spencer McDonald & Marek Travnik |
| 3rd place | Azin Al Kajbaf & Kaveh Faraji |
| 4th place | Normen Yu & Mehrdad Mahdavi |
Kristin Mullaney & Alejandro Sáez

|

|
Place: 1st Place
Prize: $20,000
University: New York University
Hometown: Chappaqua, NY, USA and Barcelona, Spain
Username: krmullaney & alasco (Stuytown2)
Background:
Kristin Mullaney: I am an incoming second year graduate student at New York University. I’m working towards a BS in Data Science. I’m very interested in all things data science and wanted to get involved in the competition in order to test my skills.
Alejandro Sáez: Data Science student at NYU with experience in predictive maintenance for power grids and analytics use cases in retail banking.
What motivated you to compete in this challenge?
There were 3 reasons motivating our interest: 1) Access to real-world data from NASA. 2) Relevance of the problem being tackled. 3) Opportunity to showcase and practice some of the techniques learned in graduate school.
Summary of approach:
We cleansed the raw data, created a master table at an airport-timestamp period with a sampling rate of 15 minutes between each observation and appended past features from each of the 12 raw data blocks provided. That is, each row of the master table contains data for a given airport-timestamp that was available before the given timestamp (past information). Next, we added the targets to be modelled, in this case the airport configuration 30 minutes ahead of time, 60 minutes … and for each lookahead period. Next, we built a total of 120 CatBoost multiclass classifiers that allowed us to predict the likelihood of each configuration at an airport-lookahead level, i.e. 10 airports x 12 lookahead periods = 120 models. Finally, we created a set of functionalities that allowed these models to be consumed by the DrivenData runtime environment in order to retrieve live predictions from the previously developed models. We followed this approach as it is the typical data science pipeline of cleansing, feature extraction, train / test split and modelling.
What are some other things you tried that didn’t necessarily make it into the final workflow?
We tried different approaches that did not make it to the final solution, among them range:
-
Feeding past predictions to future models, i.e. including as a variable for the 60minutes lookahead period the 30min prediction – did not improve the score
-
Trying a global model, i.e. one in which airport was a feature and all the other variables were considered as a cross-section of our population – This made the training process too expensive computationally and was error prone in case additional airports were added / dropped in the productization stage
-
Several different dimensionality reduction techniques which did not add any predictive power
Spencer McDonald & Marek Travnik

|

|
Place: 2nd Place
Prize: $10,000
University: Massachusetts Institute of Technology
Hometowns: Knoxville, TN, USA and Zlin, Czech Republic
Usernames: mcdonst & mtravnik (MIT AeroAstro)
Background:
McDonald is a graduate student in the Department of Aeronautics and Astronautics at MIT and a National Science Foundation Graduate Research Fellow. Before his work at MIT, McDonald worked in autonomy/controls at major aerospace companies including Boeing Commercial Airplanes and Aurora Flight Sciences. Presently, he is researching optimal scheduling and dispatching for future air transportation systems using machine learning and optimization methods. He received a Bachelor of Science in Aerospace Engineering and Applied Mathematics from the University of Tennessee.
Marek Travnik is also a graduate student in the Department of Aeronautics and Astronautics at MIT. He works as a Research Assistant in the International Center for Air Transportation laboratory, supervised by professor John Hansman. The broad focus of his research is on data-driven methods in air transport operations - currently automated runway surface condition assessment and data-driven approaches for assessing the fuel efficiency of the global aviation system. He received a Bachelor of Science in Aerospace Engineering from Delft University of Technology.
What motivated you to compete in this challenge?
McDonald and Travnik are both graduate students in the Aerospace Engineering program at MIT. We both are passionate about the aerospace discipline and the application of machine learning technologies to solve some of the hardest problems in the aerospace field. The Runway Functions competition had both an exciting and relevant application in addition to providing an opportunity for us to explore innovative ML and data science methods to predict future airport configurations.
Summary of approach:
The overall approach presented in this paper involved three main components. The first was Data Processing - performing feature engineering on the raw data to create understandable features for prediction models. The second was Submodels - train prediction models that learn relevant subtasks that are related to the overarching task of predicting runway configurations. The third and last component was the Final Model - train dense neural network that leverages the outputs of the submodels to make the final probability predictions. The fundamental idea behind the approach presented was that the submodels would find a smaller (latent) feature space that encapsulates the information that is relevant to the problem at hand. From there, the final model could use the wisdom from all the submodels to make its final prediction. In making submissions, it was found that the model could not adequately account for configuration inertia (the tendency for configurations not to change). As such, a novel approach called Minimum Configuration Support was introduced to explicitly account for configuration inertia.
What are some other things you tried that didn’t necessarily make it into the final workflow?
Before moving forward with our ensembling approach, we first wanted to consider a hidden Markov model type of approach to solving this problem. Specifically, we wanted to design models that would predict the probability of whether a configuration will change or remain stationary. From there we could use that as a prior to predicting the probability of it did change, and what configuration would it change to. While we still believe this approach has merits, it ultimately did not catch traction as it is hard to rigorously consider all possible options as the scenarios explode exponentially. In regards to the model that we did make, almost everything we wanted to make was included. One thing we left out were the scheduled and estimated arrival and departure rates, but that was left out mostly due to runtime constraints. We also did not have time to explore more interesting submodel designs, such as predicting whether an airport is IFR or VFR.
Azin Al Kajbaf & Kaveh Faraji

|

|
Place: 3rd Place
Prize: $6,000
University: University of Maryland
Usernames: azk90 & kaveh9877 (AZ--KA)
Background:
My name is Azin Al Kajbaf. I have recently earned my Ph.D. degree in Civil & Environmental Engineering from the University of Maryland. The area of my research/academic focus was "Disaster Resilience" and my research involved the application of machine learning and statistical methods in coastal and climate hazard assessment. Currently I have a joint appointment with Johns Hopkins University and the National Institute of Standards and Technology (NIST) as a postdoctoral fellow. I am leveraging data science techniques and geospatial analysis to collaborate in projects to support community resilience planning through the development of methods and tools that evaluate the economic impacts of disruptive events.
My name is Kaveh Faraji. I am a Ph.D. candidate at the University of Maryland, and I work in the area of Disaster Resilience. My main research is focused on risk assessment of natural hazards such as flood and storm surge. I am employing geospatial analysis and machine learning approaches in my research.
What motivated you to compete in this challenge?
We implement machine learning and deep learning methods in our research projects. We are interested to learn more about these approaches and their real-world application. Competing in these challenges allows us to gain experience with different machine learning and deep learning techniques that we can potentially employ in our research projects as well.
Summary of approach:
For the competition we only used the past airport configurations and training labels data. We preprocessed the data and for each data point. We extracted information about distribution of the past configurations, current and 10 last configurations, and the duration that each past configuration was active. Also, we considered current date and time (hour, day, week, month) and the lookahead as predictors. In preprocessing step, we used some of the benchmark code functions like censor_data and make_config_dist for selecting part of the data that we were allowed to use and for creating distribution of past configurations, respectively. For more information about these functions, please refer to the benchmark code. At the end of preprocessing step, we created a DataFrame (train_labels) as an input for the machine learning algorithms. In the main code, we trained XGBoost models for each airport. We then preprocessed the test data features and use pretrained XGBoost models for predicting probability of each configuration.
What are some other things you tried that didn’t necessarily make it into the final workflow?
We started with extracting different features from different datasets including: - Extracting weather information from the lamp file - Extracting estimated number of arrivals/departures for each airline in specific timespans.
We did not get the opportunity to optimize our code to include these features as predictors.
Normen Yu & Mehrdad Mahdavi


|
Place: 4th Place
Prize: $4,000
University: Pennsylvania State University
Hometown: Fort Washington, PA, USA (Normen Yu)
Usernames: pennswood & mzm616 (TeamPSU)
Background:
Normen Yu is an undergraduate student studying Computer Science at the Pennsylvania State University. He has a passion for working in the aerospace community. For example, he interned at Collins Aerospace working on UAVs, as well as a finalist on a team for the NASA BIG Idea Challenge.
Dr. Mehrdad Mahdavi is a professor at Pennsylvania State University. His research focuses on Machine Learning, and he teaches a number of graduate and undergraduate machine learning classes.
What motivated you to compete in this challenge?
The project stemmed out of an honors project that Normen was taking in Dr. Mahdavi’s class. In order to gain some practical experiences, this competition was chosen. Its dataset and problem offers an opportunity to explore many classical classification methods taught in class (SVM, Logistic Regression, Decision Tree, gradient boosting), with a twist for potential temporal decay concerns. Therefore, this competition was chosen because its scope matched the scope of the materials taught in class in a practical manner.
Summary of approach:
A number of algorithm was tested. However, Logistic Regression was ultimately used because its objective function matched closest to the objective function of the problem statement. It is also less prone to overfitting. For each airport, the following was done independently of each other: First, projected take-off and projected landing data for each airport were processed into an array of 4 columns: projected landing/takeoff 1 hour to 30 minutes ago, 30 minutes to 0 minutes ago, 0 minutes to 30 minutes into the future, and 30 to 1 hour into the future. Then, this data was added into the mix of other data that required less processing: wind_speed, wind_gust, cloud_ceiling, visibility, cloud, lightning_probability, wind_direction (wind speed direction was split/”kernelized” into a cosine and sine component), precipitation, and how many hours we are trying to look-ahead. We finally standardized the data to have the same mean and variance and train the model. We utilize the training standardization to standardize the test data. These models are saved as a pickled file and used during testing.
Due to the temporal decay that we observed, we also upweighted the training data to place a higher weight on the data points in the May/June months.
What are some other things you tried that didn’t necessarily make it into the final workflow?
Gradient boosting was tested but was too easy to overfit the data. A polynomial kernel was attempted on a number of configuration as well, but those also shown to be too complex to train from the limited data provided.
Thanks to all the participants and to our winners! Special thanks to NASA for enabling this fascinating challenge and providing the data to make it possible!


