
Hey! I'm Chris, and I'm a data scientist at DrivenData. I wanted to write this blog post because, while we work with satellite data frequently at DrivenData, I personally had not had that experience yet. Since I’m a beginner, I thought I would document the process of learning about satellite data to help others who are also trying to understand more about this data on their learning journeys.
This post will cover:
Satellites Overview


If you’re like me, you might have taken satellite images for granted. Cool satellite imagery seems ubiquitous. You might have even thought to yourself, as I did, that “a satellite is basically just a camera in space, what’s the big deal?” As it turns out, satellites are a little more than “just” cameras in space, and they are actually kind of a big deal, but I’ll use some camera analogies since I found them helpful.
What is “satellite data”?
Pedantically, satellite data is data collected by satellites that orbit the Earth. But there’s more nuance to it than that.
Satellite data is collected:
- by sensors on the satellites that are sensitive to specific ranges of wavelengths of light (the fancy term for this is spectral bands)
- at a specific time and from a specific geographic area (the fancy term for this is spatiotemporal)
- at a particular resolution, meaning that one pixel corresponds to some geographic area with units like “meters per pixel” (images have a total size that is often referred to as a scene size or frame)
- with a particular frequency known as the refresh rate, revisit time, or repeat cycle (the rate at which all geographic areas the satellite observes are re-visited)
You might also hear satellite data referred to as a subcategory of "remote sensing" data, which is effectively data collected at a distance.
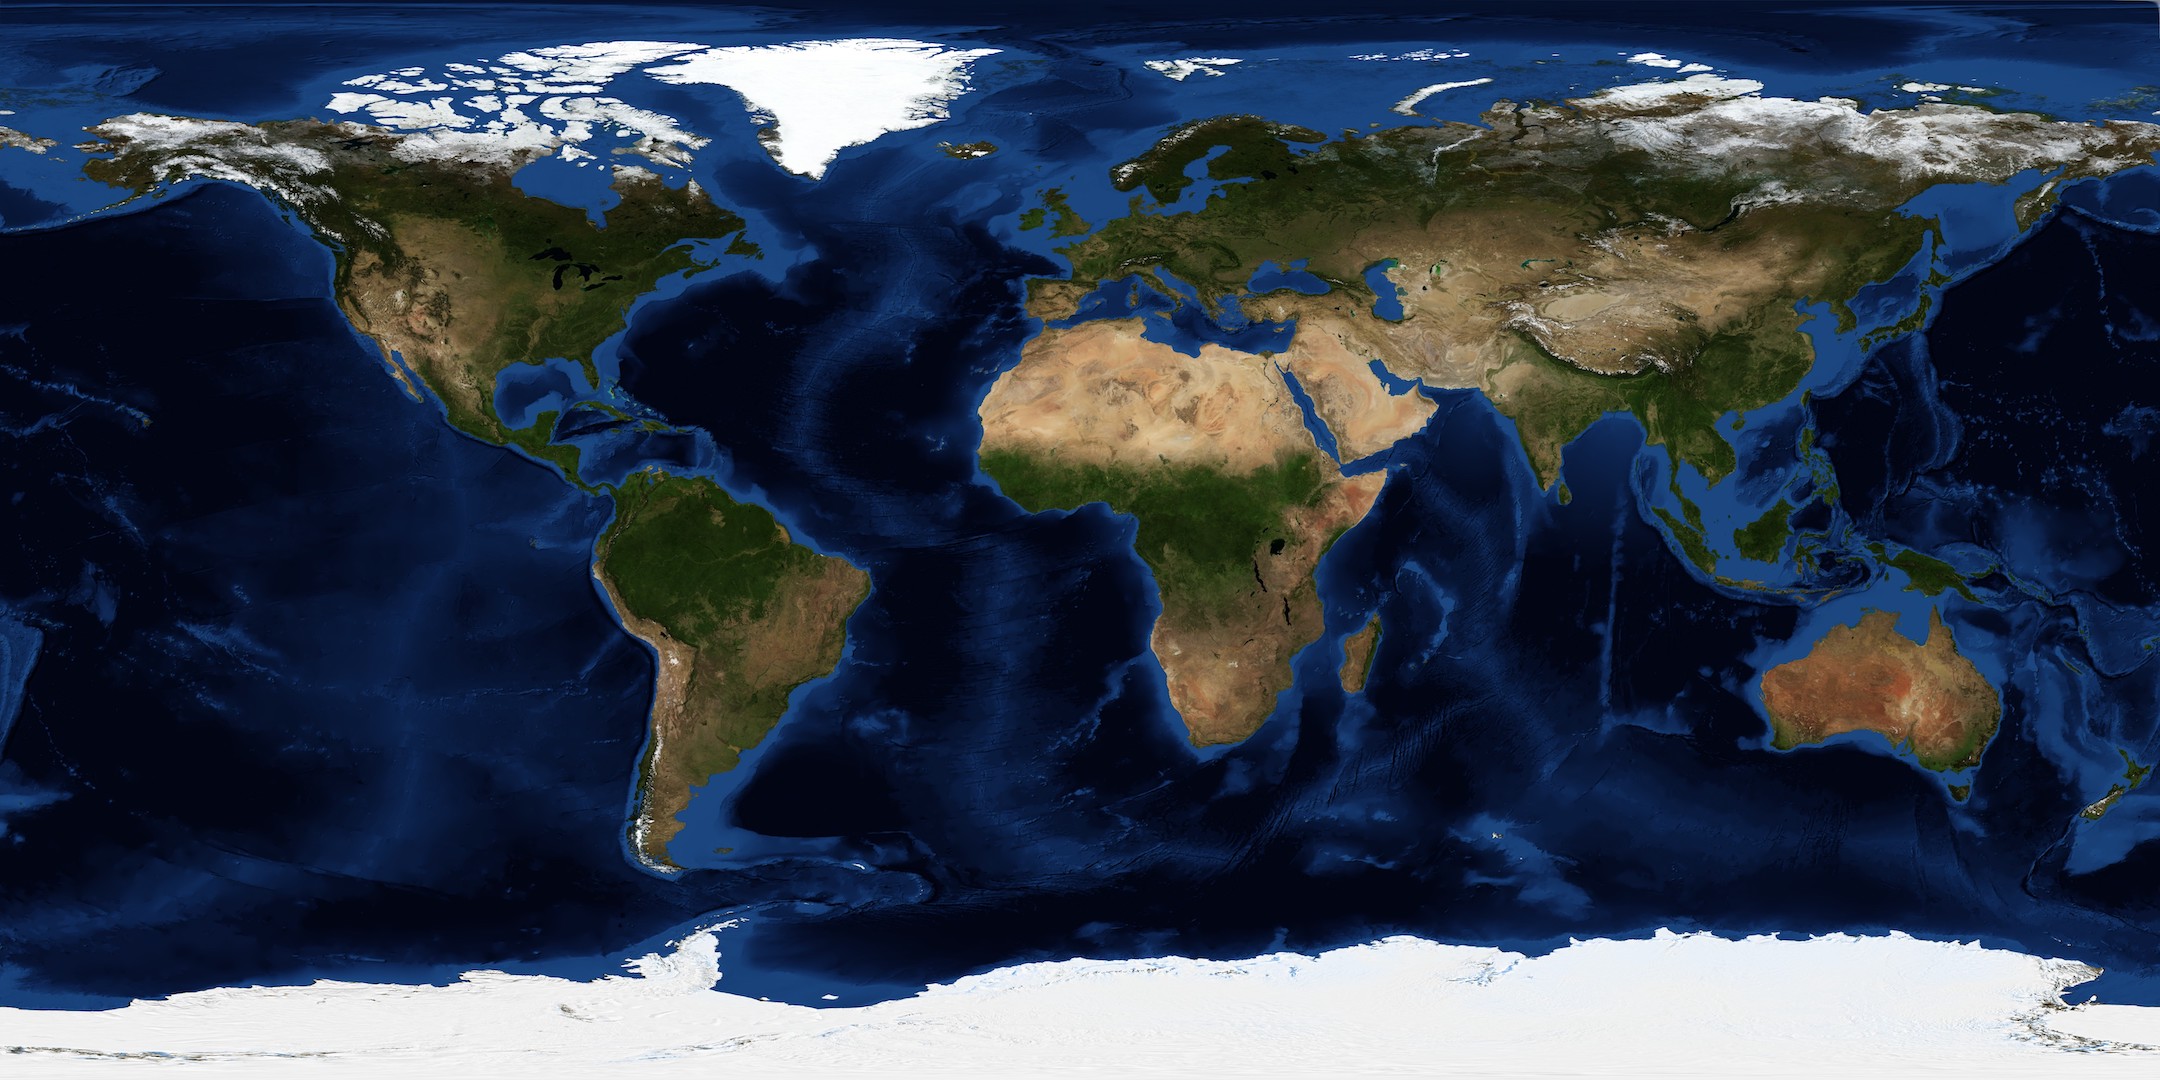
A single satellite can have multiple instruments, each instrument can have multiple sensors, and each sensor can detect light in one or more spectral bands at one or more spatial resolution. Light in different spectral bands can be used to measure different features of the Earth’s surface or atmosphere, like temperature, terrain, or pollutants. Signals from each of these bands can be combined to form a wide variety of images, from “natural color” images that resemble what we might see as humans if we were in orbit, to false-color images that show light we cannot perceive or enhance certain types of features.
This variability is helpful for different uses. Satellites with different instruments and in different orbits can allow, for example, meteorologists to measure weather patterns in near-real time, disaster responders to monitor flooding events even through cloud cover, or conservationists to map deforestation over years.
By contrast, digital photography cameras typically have one sensor that is sensitive to three bands of wavelengths of light (red, green, and blue, hence the RGB format of digital images) and have variable spatial resolution through the use of zoom lenses.
For satellites, there is an inherent trade-off between spatial resolution and refresh rate. To have a high refresh rate, the satellite needs to orbit the Earth quickly. But to capture a high-spatial-resolution photo, the satellite needs to collect data from each tiny area which takes longer. This is somewhat similar to trying to capture a long-exposure photo at night—if you stay in one place, you can get a nice image, but if you move the camera around a lot everything will come out a mess. Satellites must balance this effective “shutter speed” with their resolution in order to capture the kinds of images they were designed to collect.
In addition, satellite instruments can be passive, meaning that they simply collect the photons radiating from the Earth or bouncing off it from the Sun (just like a camera taking a picture), or active, meaning that they send some form of signal down to the Earth's surface or atmosphere and measure how it bounces back up (think a camera flash, but instead of a bright white light it’s a burst of microwave radiation). Active sensors help overcome certain limitations of passive sensors because they can penetrate clouds and can image at night.
To really hammer home (or perhaps butcher) the digital photography analogy, there is also the satellite data equivalent of RAW and JPEG images. These are known as “levels” (or “data products”) and they correspond to different amounts of processing of raw data to correct for known issues or to correspond to a specific use case. Higher “level” data is typically more processed.
I’m a little lost, can we focus on something concrete?
Sure! Let’s talk about a few satellites that are actually out in space right now and that are commonly used as data sources for a wide variety of tasks. I’ll focus on two particular satellites (or satellite missions) that are commonly used, then briefly mention a few others.
Landsat: The constant overseer

If you want to measure any sort of surface-observable feature on Earth over decadal time scales, chances are you’re going to be looking at Landsat data. Operated by NASA and the US Geological Survey, Landsat is the longest-running satellite imaging program—at least one Landsat satellite has been orbiting Earth since July 1972. There are three Landsat satellites currently in orbit (Landsat 9 is the most recent, Landsat 7 is “end of life” but is on an extended science mission at a lower orbit). Landsats 8 and 9 have two sensors each—one sensor for 9 visible and 4 near-infrared light bands and another sensor for 2 deep infrared bands—while Landsats 1-7 had a single sensor that covered between 4 and 8 visible and infrared (IR) spectral bands.
| Landsat Overview | |
|---|---|
| Date range | 1972-present (3 currently operating satellites, 9 total missions) |
| Landsat 9 Sensor Information |
Operational Land Imager 2 (OLI-2) Sensor
|
| Refresh rate | 16 days (8-day offset with Landsat 8) |
| Scene size | 180 km north-south, 185 km east-west |
Level 1 Landsat products include “raw” sensor data that has been corrected for common kinds of distortions (e.g., Earth curvature, deviations in satellite attitude and view angle, and rotation of the Earth during imaging). Level 2 data products include further corrections for atmospheric effects like clouds or transmissivity. Level 3 products use higher-level calculations or modeling to compute things like burned area or percent snow cover.
Sentinel: Purpose-built for modernity
In 2014, the European Space Agency (ESA) launched Sentinel-1, the first in a series of modern, purpose-built satellite observation missions for the European Earth Observation Programme called “Copernicus”. There are currently 6 functioning Sentinel satellites in orbit (1A, 2A/2B, 3A/3B, 5P), each of which has a unique sensor payload specific to a particular observational task.
| Sentinel-1 | Sentinel-2 | |
|---|---|---|
| Date range | 2014-present (1 currently operating satellite, 1A) | 2015-present (2 currently operating satellites, 2A and 2B) |
| Sensor information | C-Band Synthetic Aperture Radar (C-SAR)
|
MultiSpectral Instrument (MSI)
|
| Refresh rate | 12 days | 10 days (5-day offset between 2A and 2B) |
| Scene size | Mode-dependent | 290 km x 290 km |
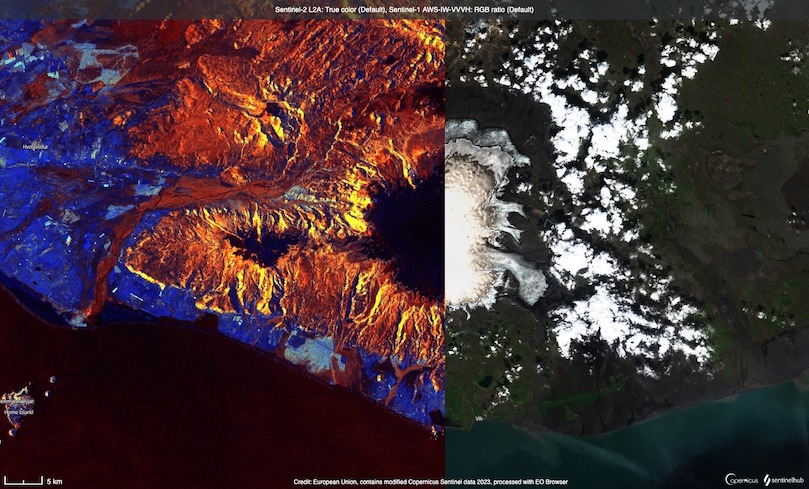
Sentinel-1 is unique because it has “C-Band Synthetic Aperture Radar” which is a type of active instrument. Rather than passively collecting photons radiating from the Earth, Sentinel-1 shoots down a burst of microwave photons and measures the resulting back-scatter to determine terrain features like elevation or roughness. Because it operates in the “C-Band” of microwave energy, it can penetrate the Earth’s atmosphere and clouds, and because it is active it can image during night as well as day.
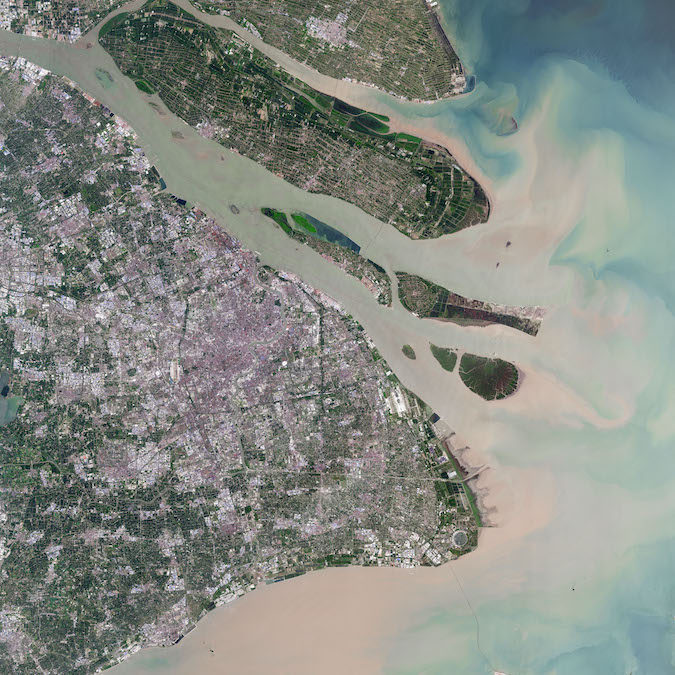
Sentinel-2 data is more similar to Landsat data, but Sentinel-2 satellites utilize modern sensors that can see in more spectral bands and at higher spatial resolution while maintaining a shorter repeat cycle.
Honorable mentions
I’ll briefly mention a few other satellites and discuss some of the interesting characteristics and trade-offs between the various features of satellite data that they represent.
-
MODIS
MODIS (Moderate Resolution Imaging Spectrometer) is an instrument on two different satellites, Aqua and Terra, that have counter-rotating orbits and image the entire Earth’s surface in 36 (!) spectral bands every two (!) days. The trade-off of such a high refresh rate is a comparatively low resolution (the highest resolution images are 250 meters per pixel).
-
Planet
Governments aren’t the only satellite game in town—private enterprises have gotten into the skies as well. Planet is a private satellite imagery company that sells its imagery as a data product. Their satellites have extremely high resolution (with some products offering resolution up to 50 cm). In order to have a reasonable refresh rate, Planet deploys multiple satellites with identical sensors so that they can have overlapping coverage areas.
-
Aura and CALIPSO
Satellites don’t just measure the surface of the Earth—they also measure properties of the atmosphere. Aura detects the signals of ozone, aerosols, and other gasses in the atmosphere using passive spectrometers, while CALIPSO (Cloud-Aerosol Lidar and Infrared Pathfinder Satellite Observation) does so using an active LIDAR (Light Detection and Ranging) instrument.
-
GOES
Rather than orbiting the Earth and imaging surfaces as it passes over them, GOES (Geostationary Operational Environment Satellites) are in a geostationary orbit and always image the same hemisphere of Earth. These satellites, operated by NASA and the NOAA, are used primarily for weather and environmental monitoring because they can provide images nearly in real time (as opposed to having to wait days to revisit the same geospatial area).
Use cases
Though satellite data ultimately is just a number of particular photons measured at a point in time from a particular geographic area, it turns out that with a little ingenuity this can get you pretty far! At DrivenData, we’ve used satellite data in our competitions to predict disaster risk, air quality, harmful algal blooms, snowpack levels, forest biomass, and more. While it's not feasible to list out every use case for satellite data, I find it helpful to refer to concrete use cases and wanted to share a few other examples I enjoyed reading about:
- Satellite data is used to measure the surface temperature of the oceans, which absorb much of the climate change-driven temperature increases.
- The Sustainability and Artificial Intelligence Lab at Stanford University has used satellite data to estimate economic well-being.
- Global Plastic Watch uses satellite data to identify and measure the growth of plastic dump sites to estimate the growth of plastic waste.
- Amazon Conservation uses satellite imagery to identify and track illegal gold mining operations.
Data access
If you want to get access to satellite data, there are a number of different ways to do so. While much data is available straight from the source for publicly funded satellite missions, there are other aggregations of satellite data that can offer more streamlined access.
- Microsoft Planetary Computer is a platform containing a data hub and cloud resources for working with satellite data from a wide variety of sources (tutorial)
- Google Earth Engine is similar but hosted on Google Cloud
- SentinelHub provides a map interface to find Sentinel satellite data directly relevant to a particular geospatial region
If you are eager to dive into a technical example for how to work directly with satellite data in code, you can check out a starter notebook from one of our competitions that utilized satellite data. There are also online courses with more in-depth and end-to-end instruction for working with remote sensing data.
Happy satting!
Thanks for joining me on my learning journey! While there's always more to learn, I hope you’ve come away from this blog post with a better understanding of what satellite data is and how you might leverage it for your own purposes.


