We are excited to put a lid (cough cough) on this competition and release the winning solutions out to the world. Congratulations to all of our competitors for all their work during the competition, and particularly to our top three finalists who you can meet below!
This challenge ran for two months, and we saw a lot of improvement over that time. Then at the beginning of July, top modelers made predictions for where minor, major, and severe hygiene violations would surface for the next 6 weeks. Over that time, we compared their predictions with what public health inspectors actually found when they went into restaurants! At the end of the evaluation period, we saw which teams had developed the most accurate predictions.
You can read about how they made their models below. We've already seen some exciting follow-up, including an article in the Washington Post. Check it out:
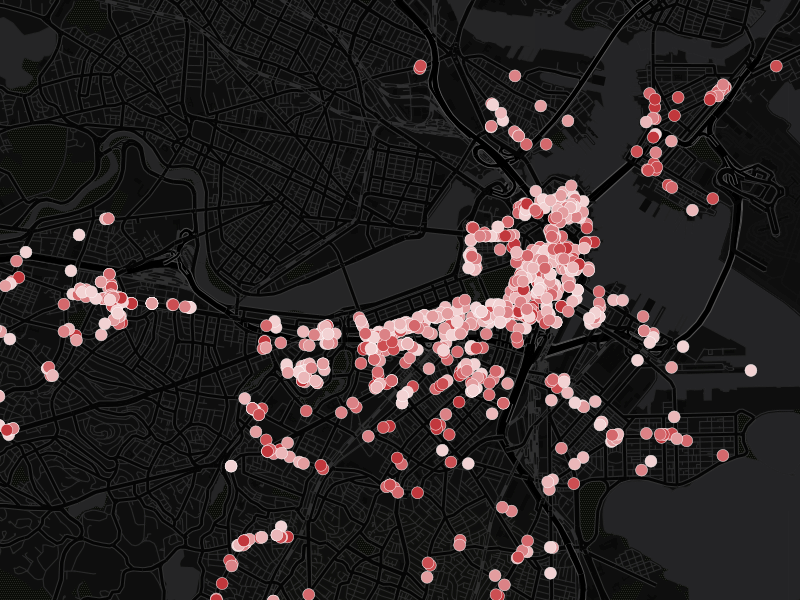
"Using the winning algorithm, [Harvard researcher Mike] Luca says, Boston could catch the same number of health violations with 40 percent fewer inspections, simply by better targeting city resources at what appear to be dirty-kitchen hotspots. The city of Boston is now considering ways to use such a model."
Way to go DrivenDatistas! If you're geared up to work on more data challenges, check out our competitions page for the latest. For the data used in Keeping it Fresh, check out this competition's open data page. Thanks for all your submissions and keep up the good work!

Meet the winners!
1st Place
Name: Liliana Medina
Home base: St. Ives, England
Background: My name is Liliana Medina, I'm a Portuguese citizen currently living and working in Cambridge, UK. I am presently a data scientist for ForecastThis, where I've been involved in the development of a machine-learning-as-a-service platform, DSX, and also in financial forecasting, web traffic fraud detection and text analysis related projects. Before this I was a data and text mining specialist for 365Media. I have an MSc in Electrical and Computer Engineering, and my thesis work was focused on pattern detection in electrophysiological signals, using unsupervised learning methods. I'm going back to college soon, as I have recently enrolled in an Astronomy certification programme at the University of Cambridge's Institute of Continuing Education.
Method overview: Liliana extracted three classes of features: information about a restaurant's history of inspections, metadata about restaurants from Yelp (e.g., the type of cuisine), and data she extracted from the Yelp reviews. Her approach to creating features from the review text involved both sentiment analysis and topic modeling. Ultimately, she combined these features into a model that averaged the predictions of a random forest and gradient boosted decision trees.
2nd Place
Name: Qingchen Wang
Home base: Surrey, Canada
Background: My name is Qingchen Wang, and I have just started as a PhD student in data science at the University of Amsterdam. I've also just started work as a consultant at ORTEC.
Method overview: Qingchen focused on building features about the restaurants based entirely on information about the restaurant inspection history and data from Yelp. He noted that many restaurants don't clean up their act after a failed inspection, so he was able to special-case predictions for these repeat-violators. Combining this inspection history information with Yelp information like the average star rating and number of reviews, he was able to train a random forest model that earned him second place.
3rd Place
Name: Shane Teehan
Home base: Dublin, Ireland
Background: I am an advanced analytics professional with an academic background in Operations Research and about ten years industry experience. I am currently managing a team of data scientists working in the aviation sector.
Method overview: In order to extract the most effective features from the model, Shane normalized the json data dump from Yelp and imported that into a Postgres database. Working in SQL allowed him to quickly explore the dataset and construct complex combinations of features about restaurants, their reviews and Yelp users. Finally, Shane included features about a restaurant's history of violations. He built four models for each target (random forest, extra random trees, gradient boosting machine, l2 logistic regression) and blended the predictions from these models to create his final submission.


