
Our world is facing many urgent challenges, like climate change, water insecurity, and food insecurity. One critical tool for addressing these challenges is Earth observation data, meaning data that is gathered in outer space about life here on Earth! Earth observation data provide accurate information on our atmosphere, oceans, ecosystems, land cover, and built environment. The United States and its partners have a long history of exploring outer space and making space-generated data openly available to all for free.
Navigating all of the available data sources can be very daunting. This blog post outlines some key public Earth observation datasets that are useful for working on climate change, water insecurity, and food insecurity. Links to key documentation and starter tutorials are included for each dataset. This post also provides an overview of resources that can help with finding datasets and putting them to use. Every dataset and resource here is completely free to use. So get started exploring the many ways Earth observation data can improve quality of life around the world!
This guide was published as part of the Pale Blue Dot: Visualization Challenge. The goal of the competition was to illustrate how Earth observation data can advance three key UN Sustainable Development Goals (SDGs): 2 - Zero Hunger, 6 - Clean Water and Sanitation, and 13 - Climate Action. To read about the results of the competition, and learn from the winning uses of Earth observation data, check out the winners blog post!
This post will cover:
Useful datasets
This section provides an overview of some widely used Earth observation datasets made publicly available by the U.S. government:
| Dataset | Description | Resolution |
|---|---|---|
| Landsat | Imagery of visible to infrared light (highest spatial resolution) | 15 - 30 m every 8 days |
| MODIS | Imagery of visible to infrared light (high spectral and temporal resolution) | 500 m every 1-2 days |
| VIIRS | Imagery of visible to infrared light (newer continuation of MODIS) | 500 m every day |
| ASTER | Imagery of visible to infrared light (high spectral resolution and high spatial resolution) | 15-90 m |
| ECOSTRESS | Imaging spectrometer measuring water loss from plants | 70 m every 1-2 days |
| GRACE-FO | Radar altimeter water movement based on gravity | 13 km every month |
| GEDI | Laser-constructed 3D map of forests | ~30 m every ~1 day |
| HRRR | Radar-based weather model | 3 km every hour |
| SMAP | Imaging radar measuring soil moisture | 36 km every 2-3 days |
| AIRS | Infrared profiler of atmospheric vapor and trace gases | 1 km every 1-2 days |
| AMSR-2 | Imagery focused on microwave emissions | 10 km every 2 days |
Not sure what some of these terms mean? No problem! Learn the basics with DrivenData's "Beginner's Guide to Satellite Data" blog post.
This post focuses on observational data sources. However, there are many modeling datasets that are derived from the data sources listed here. For example, NASA's Land Data Assimilation Systems (LDAS) combines observational data products with advanced modeling techniques.
Landsat (NASA, USGS)
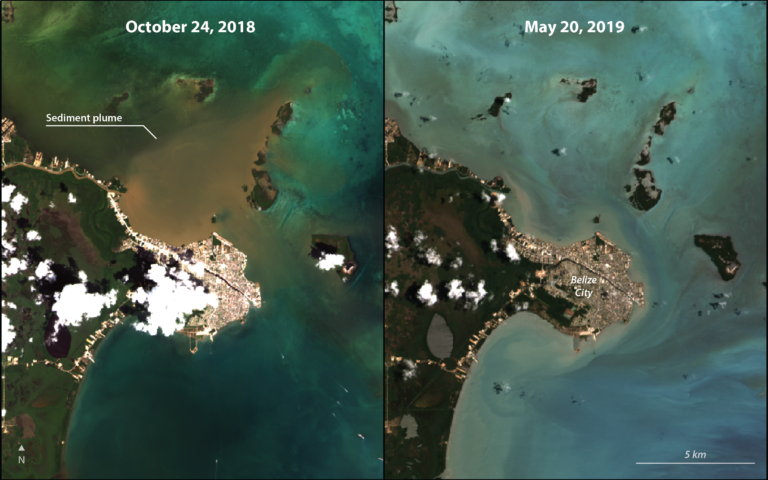
Landsat is a satellite mission that provides the longest continuous space-based record of Earth’s land in existence. Landsat is a popular source of visual Earth imagery, but also includes wavelengths that detect clouds and infrared, including thermal. Landsat satellites revisit the same location roughly every eight days, and have a spatial resolution between 15 m and 30 m depending on the spectral band. Data is collected by the Enhanced Thematic Mapper (ETM+), Operational Land Imager (OLI), and Thermal Infrared Sensor-2 (TIRS-2) instruments aboard Landsat. Landsat imagery has a wide variety of SDG applications, from mapping cropland worldwide to monitoring water quality in Belize to using land more efficiently for agriculture in Chile.
The Harmonized Landsat and Sentinel-2 (HLS) dataset combines Landsat satellite data with satellite data from the European Space Agency's Sentinel-2 mission.
Where to access the data
- Access programmatically through Microsoft’s Planetary Computer
- Download data or access programmatically through AρρEEARS
Getting started
- Example notebook from the Planetary Computer showing how to access Landsat data and perform some basic analysis (Python)
- ARSET video tutorial showing how to access Landsat imagery and classify land cover types
Other resources
- NASA's Water Quality Pathfinder (Ocean Color tab) and Agriculture and Water Management Pathfinder (Land Surface Properties / Land Surface Reflectance tab)
- Explore and visualize in NASA Worldview
- Overview of Landsat spectral bands
MODIS (NASA)
MODIS (Moderate Resolution Imaging Spectroradiometer) is an instrument that operates on two spacecraft: Terra and Aqua. MODIS data products describe a wide variety of the Earth's features, including snow cover, land surface termperature, active fires, ocean color, and sea ice. MODIS has a resolution of 500 m every 1-2 days. MODIS has a wide range of uses, from improving crop yields in India to tracking atmospheric rivers in the western U.S.
MODIS and Landsat cover similar wavelengths of light, but MODIS has much lower spatial resolution (500 m vs. 30 m). However, MODIS provides data for narrower spectral bands, and therefore has higher spectral resolution.
Where to access the data
- Access programmatically through the Planetary Computer
- Download data or access programmatically through AρρEEARS
Getting started
- Example notebooks from the Planetary Computer showing how to access and use MODIS fire data, vegetation data, temperature data, snow cover data, and visual imagery data (Python)
- Example notebook from ORNL DAAC (Oak Ridge National Laboratory Distributed Active Archive Center) showing how to download MODIS/Terra data using the modisViirsClient package and create a basic plot (Python)
Other resources
- NASA's Agriculture and Water Management Pathfinder (Snow Cover and Water Reservoirs tabs), Water Quality Pathfinder (Ocean Color tab), and Wildfires Data Pathfinder (Pre-Fire / Vegetation Greenness and Active Fire / Aerosol Optical Depth tabs)
- Explore and visualize MODIS land temperature and snow cover data in NASA Worldview
- User guides for MODIS/Terra and MODIS/Aqua
VIIRS (NASA)
Visible Infrared Imaging Radiometer Suite (VIIRS) instruments collect visible and infrared imagery of Earth's land, atmosphere, cryosphere, and ocean. VIIRS is similar to MODIS, and its snow cover and sea ice algorithms are designed to be the newer continuation of MODIS data. VIIRS has higher spatial resolution for certain spectral bands, while MODIS has higher resolution for others. For example, VIIRS has higher resolution for the thermal bands that are useful for detecting forest fires. VIIRS' Day/Night Band (DNB) sensor captures nightlight imagery that is useful for mapping populations.
Where to access the data
- Download data from Earthdata Search
- Access electricity and night lights data programmatically through the Planetary Computer
- Download data or access programmatically through AρρEEARS
Getting started
- Notebook tutorial from USGS's LP DAAC showing how to access and use VIIRS surface reflectance data (Python)
- NASA Earthdata video tutorial showing how to access VIIRS surface reflectance data
Other resources
- NASA's Agriculture and Water Management Pathfinder (Land Surface Properties / Reflectance tab) and Earthquakes and Volcanoes Pathfinder (Nighttime Lights tab)
- Explore and visualize VIIRS nighttime lights data in NASA Worldview
ASTER (NASA, METI)
The Advanced Spaceborne Thermal Emission and Reflection Radiometer (ASTER) instrument obtains high-resolution images of Earth in 14 different wavelengths of the electromagnetic spectrum, ranging from visible to thermal infrared light. ASTER data can be used to create detailed maps of land surface temperature, emissivity, reflectance, and elevation.
ASTER and MODIS are both aboard the Terra satellite. ASTER differs from MODIS in that it has much higher spatial resolution (15 - 90 m depending on the band, compared to 500 m for MODIS). However, MODIS provides data more frequently than ASTER.
Where to access the data
- Access programmatically through the Planetary Computer
- Download data or access programmatically through AρρEEARS
- Download from Earthdata Search
Getting started
- Example notebook from the Planetary Computer showing how to access and plot ASTER data (Python)
- Example notebooks from USGS's LP DAAC showing how to process and use ASTER data (Python, R)
Other resources
- NASA's Agriculture and Water Management Pathfinder (Land Surface Properties tab)
- Explore and visualize ASTER surface reflectance data in NASA Worldview
ECOSTRESS (NASA, JPL)
ECOSTRESS is an instrument aboard the International Space Station that monitors the loss of water through tiny pores in leaves. ECOSTRESS provides an indication of plant health, water scarcity and consumption, and agricultural vulnerability around the world. It provides measurements at a spatial resolution of 70 m and temporal resolution of 1-7 days. ECOSTRESS has been used in the midwestern United States to detects droughts early enough to recover and protect crops.
Where to access the data
- Download data or access programmatically through AρρEEARS
- Download from Earthdata Search
- Download from USGS's LP DAAC
Getting started
- ARSET video tutorial showing how to access and use ECOSTRESS data (see part 2)
- Workshop from USGS's LP DAAC showing how to analyze ECOSTRESS data, including a notebook tutorial (Python)
Other resources
- Mission website
- NASA's Agriculture and Water Management Pathfinder (Vegetation tab)
- Brief introductory video on YouTube
GRACE-FO (NASA, German Research Centre for Geoscience)
The GRACE-FO mission is a pair of satellites that track water movements across the planet. The movement of water affects the strength of gravity at each point above the Earth's surface. As the twin satellites orbit the Earth, the distance between them is used to measure changes in the strength of gravity, and therefore water movement. GRACE-FO can be used to track all kinds of water movement, from ice sheets to glaciers to groundwater. For example, GRACE-FO data has been used to monitor the health of critical freshwater ecosystems in Cambodia. GRACE-FO is the newer version of the original GRACE mission.
For this competition, the Level-3 mass change grids are likely more useful than Level-2 data from GRACE-FO.
Where to access the data
- Download from Earthdata Search
- Download from the Jet Propulsion Laboratory (JPL)
- Explore data and download from NASA's Giovanni
Getting started
- ARSET video tutorial showing how to access and use GRACE-FO data
- Tutorial from PO.DAAC showing how to download GRACE-FO data programmatically from Earthdata Search and use it to study the Amazon river basin (Python)
Other resources
- View and experiment with data in the interactive online GRACE Data Analysis Tool
- NASA's Agriculture and Water Management Pathfinder (Groundwater tab) and Sea Level Change Pathfinder (Glaciers & Ice Sheets tab)
GEDI (NASA, University of Maryland)
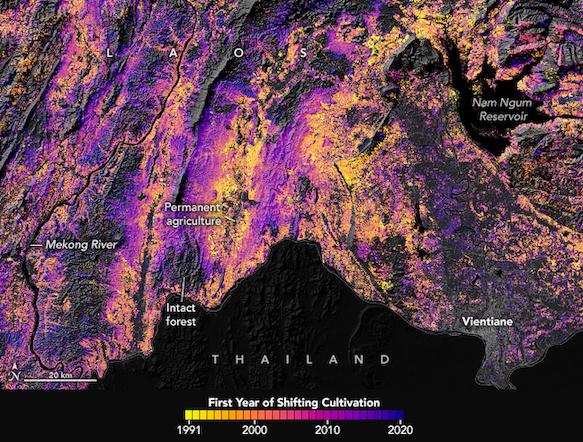
The Global Ecosystem Dynamics Investigation (GEDI) is an instrument that acquires data via three lasers installed on the International Space Station. GEDI can be used to construct detailed 3D maps of forest canopies, branches, and leaves, as well as to study animal habitats and biodiversity. Forests store a huge amount of biomass and carbon, and mapping them provides insight into Earth's carbon cycle and how it is changing. For example, GEDI has been used to map where different types of crops are being grown globally and to study shifting cultivation in Laos.

Where to access the data
- Download from Earthdata Search
- Download using the Spatial Access Tool through the Oak Ridge National Laboratory Distributed Active Archive Center (ORNL DAAC).
Getting started
- Repository of tutorials from ORNL DAAC showing how to access GEDI data in several different ways (Python)
- Example notebooks from USGS's LP DAAC showing how to load and use GEDI L1B, L2A, and L2B data (Python)
- Video tutorial from NASA Earthdata showing how to access GEDI data through LP DAAC and analyze it with Python
Other resources
- NASA's Agriculture and Water Management Pathfinder (Vegetation / Aboveground Biomass Density and Land Surface Properties / Topography tabs)
- Explore and visualize in NASA Worldview
HRRR (NOAA)
High-resolution rapid refresh (HRRR) is a weather model that generates frequent estimates of climate conditions like temperature and humidity based on radar data. HRRR updates every single hour and provides estimates with 3-km resolution. HRRR has been used for applications like predicting the path of wildfire smoke and optimizing wind energy use.
Where to access the data
- Access programmatically through the Microsoft Azure
- Access programmatically through AWS
Getting started
- Example notebook showing how to access and use HRRR data with Microsoft Azure (Python)
- Example script showing how to download HRRR data through AWS (Python)
Tips
- Herbie is a python package that makes it easier to download HRRR data.
SMAP (NASA, USDA)
The Soil Moisture Active Passive (SMAP) satellite mission measures moisture in surface soil around the world. Data is available every 2-3 days at a resolution of 9-36 km. SMAP has been used for projects like monitoring drought in the midwestern United States.
Where to access the data
- Download data or access programmatically through AρρEEARS
- Download from Earthdata Search
- Access sea surface salinity data programmatically through AWS
Getting started
- Example notebook from PO.DAAC showing how to download SMAP sea surface salinity and precipitation data using Earthdata Search (Python)
- Related PO.DAAC notebook loading SMAP salinity data from the cloud and comparing it with another dataset
- ARSET video tutorial providing an overview of SMAP, its agricultural applications, and how to access it with Earthdata or the National Snow and Ice Data Center (see part 2)
Other resources
- NASA's Agriculture and Water Management Pathfinder (Water / Soil Moisture tab)
- Explore and visualize in NASA Worldview
AIRS (NASA, JPL)
The Atsmopheric Infrared Sounder (AIRS) instrument measures infrared energy emitted from the Earth's surface and atmosphere. It provides 3D measurements of water vapor, clouds, and trace gases like carbon dioxide, methane, and ozone that impact climate change. AIRS data is often used to improve weather forecasts, build climate models, and monitor volcanic plumes. AIRS and MODIS are both aboard the Aqua satellite.
The Ozone Monitoring Instrument (OMI), aboard NASA's Aura satellite, is similar to AIRS. OMI also focuses on trace gases like ozone and sulfur dioxide, as well as aerosols.
Where to access the data
- Download from Earthdata Search
- Explore data and download from NASA's Giovanni
Getting started
- Example notebook from NASA Earthdata showing how to download AIRS data manually from Giovanni and calculate growth rates programmatically (Python)
- Example script showing how to access AIRS data from the Goddard Earth Sciences Data and Information Services Center (GES DISC) (Python)
Other resources
- NASA's Greenhouse Gases Pathfinder and Air Quality Pathfinder (Trace Gas Data tab)
- View and experiment with the data online in JPL's AIRS Browse Tool
AMSR-2 (NASA, Japan Aerospace Exploration Agency)
The Advanced Microwave Scanning Radiometer 2 (AMSR-2) instrument collects data on global precipitation, ocean wind speed, water vapor, sea ice concentration, brightness temperature, and soil moisture. Compared to other imaging satellites like MODIS and Landsat, AMSR-2 focuses on microwave emissions. For example, AMSR-2 can be used to measure the rate at which rain is falling on the ocean, or the level of moisture in soil. Data is available every 2 days at a spatial resolution of 10 km. AMSR-2 is aboard the Japanese SHIZUKU satellite.
Where to access the data
- Explore data and download from NASA's Giovanni
- Download from Earthdata Search
- Access sea surface temperature data progammatically through AWS
Other resources
- NASA's Agriculture and Water Management Pathfinder (Snow Cover, Soil Moisture, and Precipitation tabs)
- Explore and visualize precipitation data and soil moisture data in NASA Worldview
Recommended resources
There are many resources that provide additional guidance for finding and using Earth observation data. We've outlined a few below.
Identifying datasets
The resources below help with identifying useful datasets based on a subject area of interest.
-
NASA Data Pathfinders: Data Pathfinders guide users through identifying useful datasets based on specific topics of interest. There are pathfinders for a variety of issues, from water quality to agriculture. Each pathfinder provides an overview of datasets relevant to the issue and information about how to access each dataset.
-
NASA Backgrounders: Backgrounders are informational articles providing a deeper explanation of key topics in Earth science to aid in understanding data and data use. For example, you can learn more about the Sustainable Development Goals, remote sensing, or environmental justice.
-
NASA Earthdata: NASA Earthdata is the main hub for searching all of the Earth science datasets made available by NASA. NASA Earthdata connects to Earthdata Search for downloading datasets.
Accessing data
The resources below help with accessing and downloading data.
-
Earthdata Search: Earthdata Search is NASA's repository of publicly available Earth science datasets. Data can be downloaded through the online user interface or programmatically. See the "Data Access" documentation page for instructions to download data programmatically with example code in Python, R, and more.
-
Planetary Computer: Microsoft's Planetary Computer hosts a multi-petabyte catalog of global environmental data. It provides an API for accessing data, as well as an online development environment. For example, you can access Landsat, MODIS, HRRR, and ASTER data through the Planetary Computer.
-
AρρEEARS: USGS's Application for Extracting and Exploring Analysis Ready Samples (AρρEEARS) provides a simple, user-friendly, and efficient way to search, preview, and download geospatial data. Users can search by time, geographic area, and data layer without needing to understand the specific file naming conventions of each data source. There is an online interface and an API to download data programmatically. AρρEEARS' data catalog includes most of the sources described in this post.
Dr. Brianna Lind, a Geospatial Data Scientist and AρρEEARS expert, hosted a live tutorial for Pale Blue Dot challenge participants demonstrating how to search for and download data using the online interface. A recording is available at this link. For more tips on using the API, there are notebook tutorials for both Python and R in a GitHub repository.
-
VEDA Dashboard: VEDA (Visualization, Exploration, and Data Analysis) is NASA's open-source Earth Science platform in the cloud. You can use VEDA to discover Earth observation datasets, as well as to easily visualize data online.
-
Giovanni: Giovanni is another tool from NASA that allows users to search for and download specific datasets. It also allows users to visualize datasets online.
Visualizing data
Use the tools below to easily visualize and experiment with data. The VEDA Dashboard and Giovanni tools outlined above also have useful visualization features.
-
NASA Worldview: NASA Worldview allows you to easily visualize publicly available satellite and environmental data. The base layer shows visual imagery, and you can add a huge variety of additional layers like air quality, night lights, and temperature.
-
State of the Ocean Worldview: State of the Ocean (SOTO) Worldview is an easy-to-use online tool for visualizing NASA ocean data. It links to Earthdata Search for downloading any of the datasets featured.
-
NASA HiTIDE: HiTIDE, the High-level Tool for Interactive Data Extraction, allows users to peruse and preview popular level 2 (swath) datasets. Users can filter based on spatial and temporal boundaries, see instant previews, and download data.
Learn more
Dive deeper and keep learning!
-
Project Pythia: Project Pythia is an education and training hub for working with geoscience data in Python. It includes tutorials to get started with Python, as well as guides for advanced and specific workflows.
-
NASA ARSET: NASA's Applied Remote Sensing Training program (ARSET) provides online tutorials and webinars to guide users working on topics like agriculture, disasters, and public health. You can watch recordings of past tutorials, or sign up to join a tutorial live. For example, get a quick subject overview with the ARSET tutorial on "Earth Observations for Monitoring the UN Sustainable Development Goals"
-
PO.DAAC Cookbook: The PO.DAAC Cookbook is a tutorial repository for the Physical Oceanography Distributed Active Archive Center (PO.DAAC). Peruse a huge variety of tutorials, mostly as Jupyter notebooks, demonstrating how to access and use a variety of NASA’s ocean, climate, and surface water data.
-
A Beginner's Guide to Satellite Data: Check out DrivenData's blog post for getting started with satellite imagery. You'll learn the basics of what satellite imagery is, what different types of satellite imagery are available, and how they can be used.
Image source: NASA Earth Observatory images by Lauren Dauphin, using data from Chen, Shijuan, et al. (2023). Map of shifting cultivation in Laos created using Landsat and GEDI data.


