In a previous blog post, we showed that we can use predictions from Zamba to classify videos from camera traps, keeping the ones that actually show animals and automatically removing the ones that are blank.
-
For each video, Zamba generates a probability that it is blank. And these probabilities are generally well calibrated, so in a set of videos with probability 0.5, for example, the percentage that are blank is close to 50%.
-
If we choose a threshold for the probability of being blank, and discard videos that exceed the threshold, we can typically remove 80-90% of the blank videos while wrongly discarding only 10-20% of the videos that contain animals.
That's a promising result, but it leaves an important question unanswered: when we don't know what our videos contain, how should we choose the threshold probability?
|
|
In our evaluation so far, we have used labels assigned by human viewers to compute the fraction of blanks removed and the fraction of non-blank videos discarded. But people using Zamba don't generally have labels like this — if they did, they would not need Zamba! So here's the challenge: can we choose a threshold automatically, using only the predicted probabilities from Zamba?
Recently we've developed an algorithm that can help.
Choosing the threshold
Here's an outline of the algorithm (with details below):
-
Use Zamba's predictions to estimate the number of non-blank videos.
-
Choose a target level for the loss of non-blank videos.
-
Sort the videos in ascending order by their probability of being non-blank.
-
Compute the cumulative sum of the probabilities.
-
Find the video where the cumulative sum exceeds the target.
-
The threshold is that video's probability of being blank.
To demonstrate the algorithm, we'll use the African species model; specifically, we'll consider 30,524 videos from the holdout set, that is, videos from locations that were not used for training the model.
The first step is to estimate the number of non-blank videos. We do that by selecting the probability that each video is non-blank and adding them up. If the predictions are well calibrated, we expect this total to be a good estimate. For the videos in the holdout set, the total of these probabilities is 18,152; the actual number of non-blank videos (according to human viewers) is 17,490. So we're off by about 4%, which is not bad.
The next step is to choose a target level for the loss of non-blank videos. In general, if we are willing to lose more non-blanks, we can remove more blanks. But collecting videos can be difficult and expensive, so we don't want to lose too much valuable data! As an example, suppose the acceptable loss is 10%.
The third step is to sort the videos in ascending order by their probability of being non-blank, and then compute the cumulative sum of the probabilities. The following figure shows the result for the videos in the holdout set.
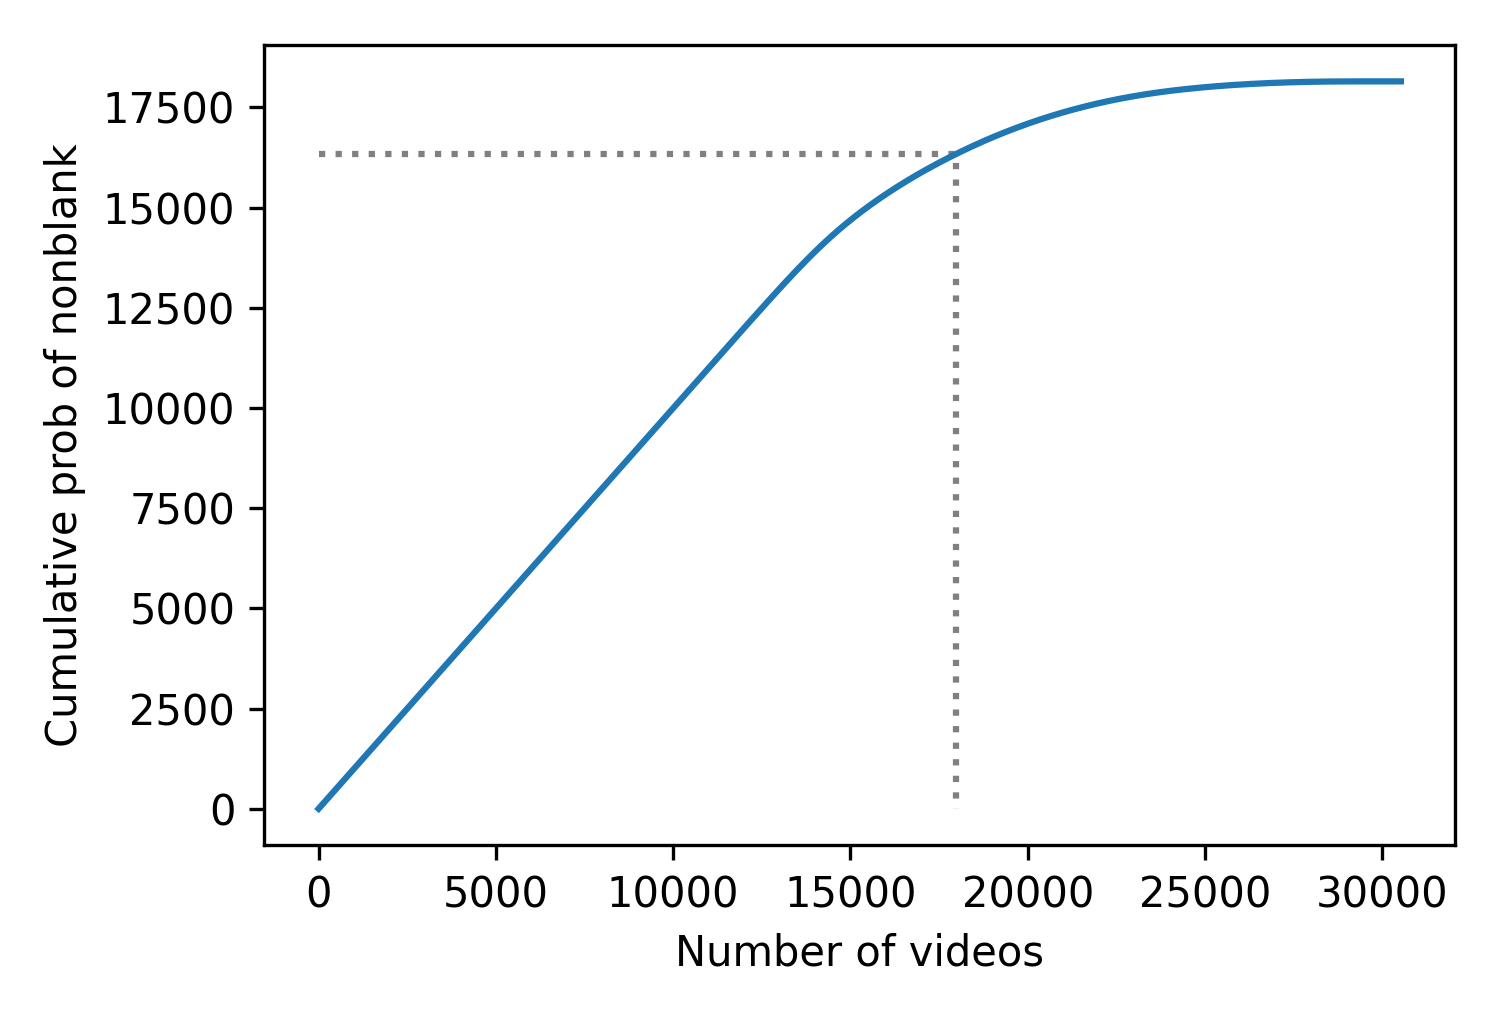
The x-axis shows the ranks of the videos in order from highest to lowest probability of being non-blank. The y-axis shows the cumulative probabilities.
Now, if we are willing to lose 10% of the non-blanks, that means we want to keep the other 90%. If we compute 90% of the total probability, we can use that goal to choose a stopping point. In this example, the goal is 16,337, shown by the horizontal dotted line.
By interpolation, we can find the rank of the video that corresponds to this goal. In this example, the result is 17,972, shown by the vertical dotted line.
These results suggest that if we watched 17,972 videos — in this order — we would expect to find 15,337 non-blank videos, which is 90% of the number we think there are.
Of course, no one wants to watch that many videos! However, if we select the video with rank 17,972, we can use as the threshold its probability of being blank. The videos with probabilities that exceed this threshold are to the right of the vertical line, where we expect to find only 10% of the non-blank videos.
In this example, the threshold we would choose is 0.56. Using this threshold, we would remove 12,550 videos, which is 41% of the total. Of those, 10,667 are in fact blank, which means we can remove 82% of the blank videos.
However, among the videos that exceed the threshold, 1,883 are non-blank, which means we would lose 11% of the videos that are actually non-blank. That's a little higher than the 10% target, but it is pretty close.
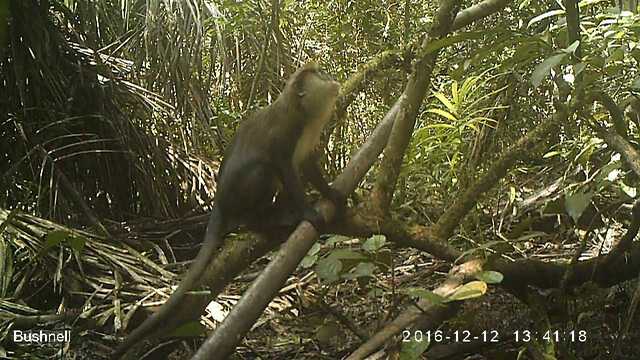
Here's a regrettable example of a non-blank video we would discard in this scenario. Although it contains several monkeys, they are partly obscured and not easy to spot, even for a human. Zamba assigns the monkey/prosimian label only 18% probability; it assigns the blank label a 57% probability, which is just barely above the threshold we chose.
It is a shame to discard a video like this, but if removing blank videos allows a human viewer to allocate their time more effectively, some accidental losses might be acceptable.
Varying the target
In the previous example, the 10% target was an arbitrary choice. Depending on the goal of the project and the properties of the video collection, we might be willing to tolerate higher or lower losses. So let's see how the algorithm handles different targets.
We computed thresholds for a range of target losses, and used the labels to check the actual losses. The following figure shows the results:
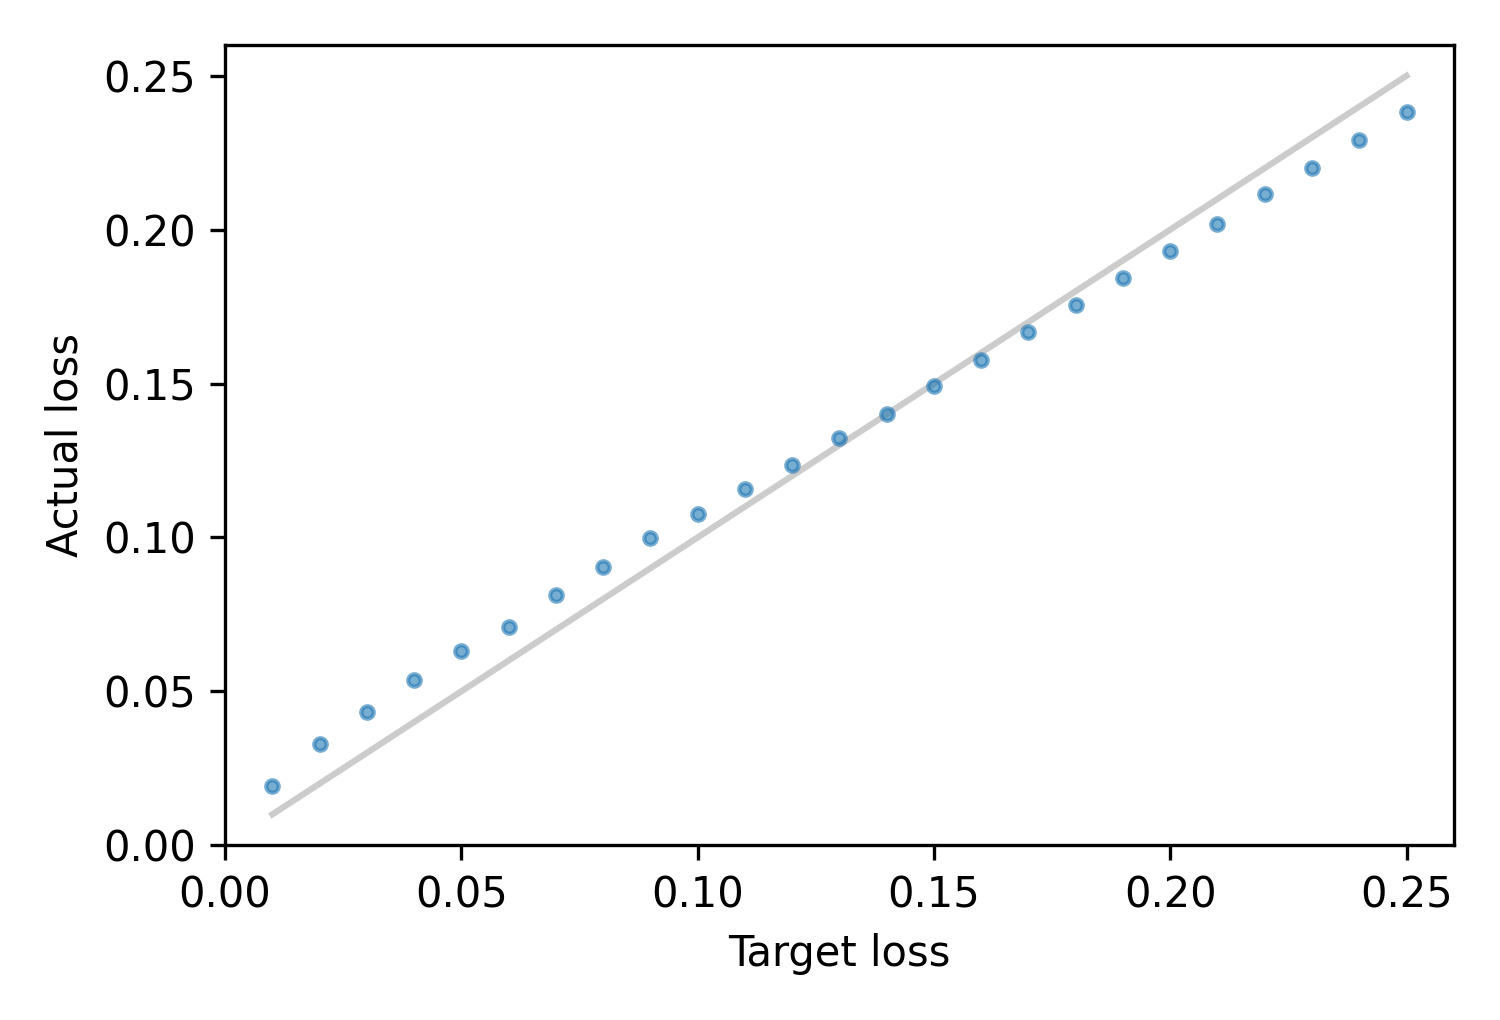
Across a range from 1% to 25%, the actual losses are generally close to the target: below 15%, they are a little higher; above 15%, they are a little lower.
Comparing locations
As we saw in the previous article on removing blanks, there are differences between videos collected by researchers in different locations. The fraction of blank videos varies, depending on how videos are collected and processed, and the accuracy of the predictions varies, depending on video quality and the mixture of species.
With all of these differences, we found that the fraction of blank videos we can remove, and the fraction of non-blanks we lose, can be substantially different. And the threshold that yields the target loss rate varies as well.
In the holdout set, we have video collections from several researchers, so we can simulate the results each of them would get by using our algorithm to choose a threshold. The following table shows the results, with one row for each collection. We omitted two collections that contain no blanks, on the assumption that the researchers removed all of the blanks before sharing their videos with us.
| collection | % blank | prob blank | threshold | % blank removed | % non-blank lost |
|---|---|---|---|---|---|
| 1 | 87% | 86% | 0.7 | 97% | 8.8% |
| 2 | 41% | 39% | 0.52 | 87% | 10.2% |
| 3 | 44% | 43% | 0.64 | 72% | 10.3% |
| 4 | 9% | 10% | 0.00092 | 100% | 10.5% |
| 5 | 46% | 37% | 0.61 | 40% | 13.2% |
| 6 | 13% | 24% | 0.51 | 52% | 18.2% |
The first column shows that the actual fraction of blank videos varies between collections, from 9% to 87%.
The second column shows the estimated fraction of blank videos, based on the predicted probabilities; it is generally a good estimate, although less good for collections 5 and 6.
The third column shows the threshold chosen by our algorithm. It is usually not too far from 0.5, but for collection 4 it is much lower; with this threshold, we are able to remove 100% of the blank videos while losing only 10.5% of the non-blanks.
The last column shows that the actual loss rate is usually close to the target, but not always. In collection 6, we overestimate the number of blanks, set the threshold too low, and lose too many non-blanks — more than 18%.
Collections 5 and 6 are clearly more challenging than the others: the fraction of blanks we can remove is lower and the fraction of non-blanks we lose is higher. Nevertheless, the algorithm chooses reasonable thresholds across diverse conditions, and usually keeps the actual losses close to the target.
The following table shows the same analysis across the countries where the videos were collected. We omitted one country where there were no blank videos.
| country | % blank | prob blank | threshold | % blank removed | % non-blank lost |
|---|---|---|---|---|---|
| Cameroon | 30% | 32% | 0.58 | 71% | 15.6% |
| Central African Republic | 13% | 24% | 0.51 | 52% | 18.2% |
| DR Congo | 48% | 38% | 0.61 | 43% | 12.6% |
| Equatorial Guinea | 92% | 87% | 0.62 | 91% | 0.0% |
| Gabon | 23% | 20% | 0.12 | 95% | 8.4% |
| Guinea | 59% | 55% | 0.46 | 94% | 6.4% |
| Ivory Coast | 44% | 43% | 0.63 | 75% | 10.8% |
| Liberia | 42% | 41% | 0.59 | 84% | 13.7% |
| Nigeria | 56% | 53% | 0.63 | 88% | 9.1% |
| Republic of Congo | 18% | 21% | 0.13 | 96% | 13.5% |
| Senegal | 64% | 62% | 0.79 | 84% | 4.2% |
| Tanzania | 46% | 43% | 0.25 | 97% | 7.3% |
| Uganda | 37% | 34% | 0.44 | 88% | 10.0% |
The results are similar:
-
The fraction of blank videos varies between locations, from 13% to 92%.
-
The total probability of blank videos is usually a good estimate of the actual fraction.
-
The selected threshold varies substantially between locations.
-
The fraction of blanks we can remove is usually around 80% or 90%, but it is lower in some locations.
-
The fraction of non-blanks we lose is centered around the target, 10%, and usually within a few percentage points.
It's clear that differences across locations make it challenging to achieve a target loss rate with precision. Nevertheless, the threshold-selection algorithm does a reasonable job across a variety of conditions.
In conclusion, we can use Zamba's predicted probabilities to remove blank videos while controlling the fraction of non-blank videos we lose.
Implementation
Here is an implementation of the algorithm in Python. It takes as input the probabilistic predictions generated by Zamba and a fraction of non-blanks it is acceptable to lose. It returns the chosen threshold.
def choose_threshold(pnb, target_loss):
    """Choose a threshold on p(blank) given tolerable loss of non-blank.

    pnb: array of prob(non-blank)
    target_loss: acceptable fraction of non-blank to lose (0-1)

    returns: float
    """
    # sort the probabilities and compute the cumulative sum
    pnb_sorted = np.sort(pnb)[::-1]
    pnb_cumulative = pnb_sorted.cumsum()

    # estimate the total number of non-blanks
    total_nb = pnb_cumulative[-1]
    goal = total_nb * (1 - target_loss)

    # look up the threshold at the target loss
    rank = (pnb_cumulative >= goal).argmax()
    thresh = 1 - pnb_sorted[rank]
    return thresh
The algorithm is simple enough to be implemented in a spreadsheet: here's an example using a sample of 100 probabilities.


